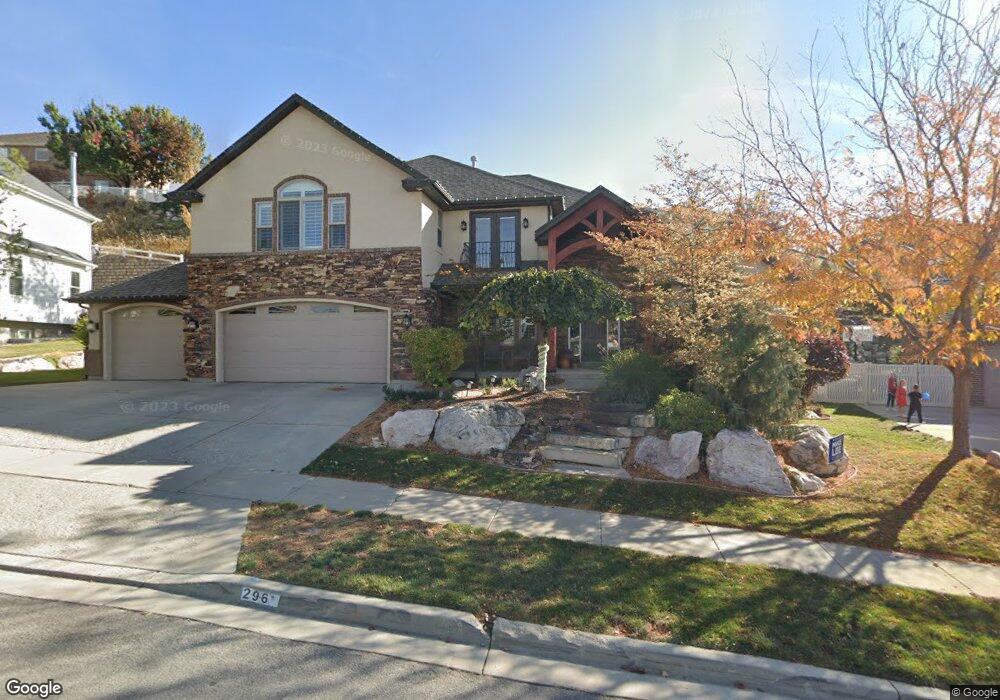
296 Maxine Cir Bountiful, UT 84010
Estimated Value: $863,000 - $1,036,000
4
Beds
3
Baths
4,521
Sq Ft
$215/Sq Ft
Est. Value
About This Home
This home is located at 296 Maxine Cir, Bountiful, UT 84010 and is currently estimated at $969,827, approximately $214 per square foot. 296 Maxine Cir is a home located in Davis County with nearby schools including Muir School, Mueller Park Junior High School, and Woods Cross High School.
Ownership History
Date
Name
Owned For
Owner Type
Purchase Details
Closed on
Sep 25, 2009
Sold by
Gallagher John S and Gallagher Tracie L
Bought by
Gallagher Tracie L
Current Estimated Value
Purchase Details
Closed on
Jul 21, 2005
Sold by
Foss Lewis Associates Lc
Bought by
Gallagher John S and Gallagher Tracie L
Home Financials for this Owner
Home Financials are based on the most recent Mortgage that was taken out on this home.
Original Mortgage
$330,000
Outstanding Balance
$171,150
Interest Rate
5.56%
Mortgage Type
Purchase Money Mortgage
Estimated Equity
$798,677
Purchase Details
Closed on
May 19, 2004
Sold by
Tinker Paul A and Tinker Diane
Bought by
Foss Lewis Associates Lc
Purchase Details
Closed on
Oct 1, 2003
Sold by
Foss Lewis Associates Lc
Bought by
Tinker Paul A and Tinker Diane
Create a Home Valuation Report for This Property
The Home Valuation Report is an in-depth analysis detailing your home's value as well as a comparison with similar homes in the area
Purchase History
| Date | Buyer | Sale Price | Title Company |
|---|---|---|---|
| Gallagher Tracie L | -- | None Available | |
| Gallagher John S | -- | Aspen Title Insurance Agency | |
| Foss Lewis Associates Lc | -- | Aspen Title Insurance Agency | |
| Tinker Paul A | -- | Equity Title Agency |
Source: Public Records
Mortgage History
| Date | Status | Borrower | Loan Amount |
|---|---|---|---|
| Open | Gallagher John S | $330,000 |
Source: Public Records
Tax History
| Year | Tax Paid | Tax Assessment Tax Assessment Total Assessment is a certain percentage of the fair market value that is determined by local assessors to be the total taxable value of land and additions on the property. | Land | Improvement |
|---|---|---|---|---|
| 2025 | $6,052 | $567,050 | $153,721 | $413,329 |
| 2024 | $5,721 | $550,550 | $141,403 | $409,147 |
| 2023 | $5,316 | $926,000 | $260,705 | $665,295 |
| 2022 | $4,961 | $471,900 | $139,430 | $332,470 |
| 2021 | $4,376 | $637,000 | $207,606 | $429,394 |
| 2020 | $3,916 | $573,000 | $188,940 | $384,060 |
| 2019 | $3,820 | $545,000 | $176,632 | $368,368 |
| 2018 | $3,553 | $499,000 | $165,341 | $333,659 |
| 2016 | $3,096 | $235,620 | $56,695 | $178,925 |
| 2015 | $3,236 | $231,000 | $56,695 | $174,305 |
| 2014 | $3,213 | $238,200 | $56,695 | $181,505 |
| 2013 | -- | $247,322 | $76,913 | $170,409 |
Source: Public Records
Map
Nearby Homes
- 438 Indian Springs Rd
- 610 Meadowlark Ln
- 69 E North Canyon Rd
- 424 E Canyon Estates Dr S
- 2292 S 250 E
- 19 E North Canyon Rd
- 2273 S 200 E
- 110 2250 S
- 320 E 2100 S
- 8 E 3500 S
- 761 San Simeon Way
- 2053 S 350 E Unit 7
- 3716 S Oakridge Cir
- 2046 S 350 E Unit 4
- 296 E 2050 S Unit 2
- 295 E 2050 S Unit 1
- 3727 S 400 E
- 41 E 2200 S
- 2038 S 350 E Unit 3
- 188 E 2050 S Unit D3
- 349 E North Canyon Rd
- 367 E North Canyon Rd
- 324 Maxine Cir
- 2637 Lewis Park Dr
- 2685 Lewis Park Dr
- 311 Maxine Cir
- 333 E North Canyon Rd
- 2796 S 400 E
- 2551 Lewis Park Dr
- 2763 Lewis Park Dr
- 385 E North Canyon Rd
- 325 Maxine Cir
- 366 E North Canyon Rd
- 338 Maxine Cir
- 311 E North Canyon Rd
- 2684 Lewis Park Dr
- 2628 Lewis Park Dr
- 350 N Canyon Rd
- 350 E North Canyon Rd
- 2842 S 400 E
Your Personal Tour Guide
Ask me questions while you tour the home.