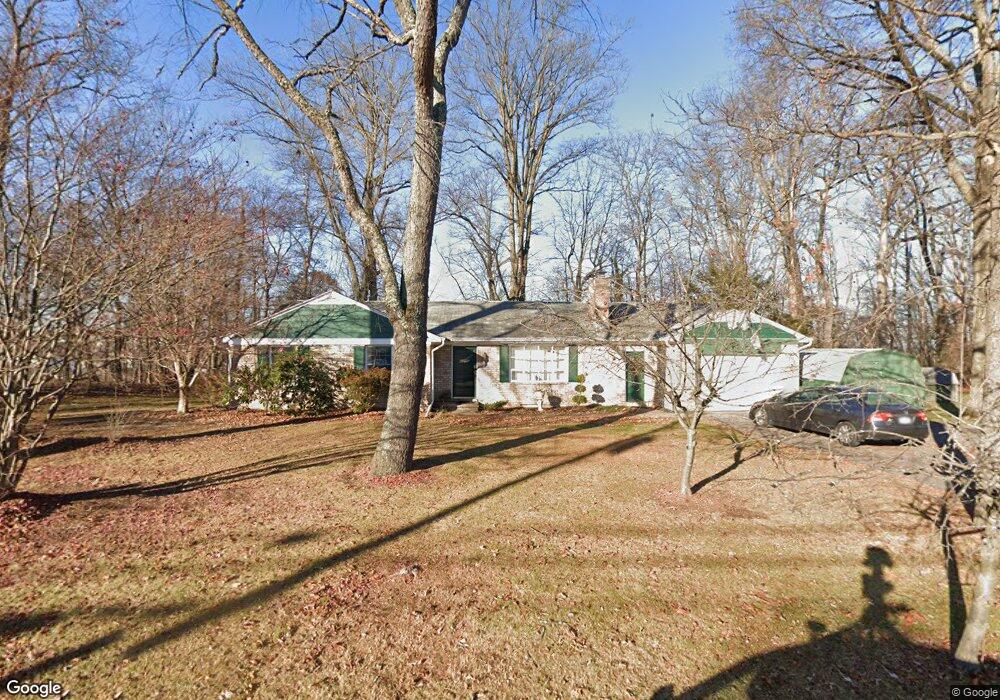
296 Ore Bank Rd Dillsburg, PA 17019
Estimated Value: $303,000 - $330,000
3
Beds
2
Baths
1,632
Sq Ft
$195/Sq Ft
Est. Value
About This Home
This home is located at 296 Ore Bank Rd, Dillsburg, PA 17019 and is currently estimated at $318,447, approximately $195 per square foot. 296 Ore Bank Rd is a home located in York County with nearby schools including Northern Middle School and Northern High School.
Ownership History
Date
Name
Owned For
Owner Type
Purchase Details
Closed on
Feb 18, 2011
Sold by
Mummert Sara E and Mummert Duane Michael
Bought by
Potter George F
Current Estimated Value
Home Financials for this Owner
Home Financials are based on the most recent Mortgage that was taken out on this home.
Original Mortgage
$164,715
Outstanding Balance
$107,050
Interest Rate
3.75%
Mortgage Type
FHA
Estimated Equity
$211,397
Purchase Details
Closed on
Oct 10, 2001
Sold by
Potocki Robert A and Potocki Wendy K
Bought by
Potocki Robert A
Home Financials for this Owner
Home Financials are based on the most recent Mortgage that was taken out on this home.
Original Mortgage
$138,190
Interest Rate
6.92%
Mortgage Type
VA
Purchase Details
Closed on
Jul 22, 2000
Sold by
Jones Robert L and Jones Helen L
Bought by
Potocki Robert A and Potocki Wendy K
Home Financials for this Owner
Home Financials are based on the most recent Mortgage that was taken out on this home.
Original Mortgage
$136,300
Interest Rate
8.18%
Mortgage Type
VA
Create a Home Valuation Report for This Property
The Home Valuation Report is an in-depth analysis detailing your home's value as well as a comparison with similar homes in the area
Home Values in the Area
Average Home Value in this Area
Purchase History
| Date | Buyer | Sale Price | Title Company |
|---|---|---|---|
| Potter George F | $169,000 | None Available | |
| Potocki Robert A | -- | -- | |
| Potocki Robert A | $143,500 | -- |
Source: Public Records
Mortgage History
| Date | Status | Borrower | Loan Amount |
|---|---|---|---|
| Open | Potter George F | $164,715 | |
| Previous Owner | Potocki Robert A | $138,190 | |
| Previous Owner | Potocki Robert A | $136,300 |
Source: Public Records
Tax History Compared to Growth
Tax History
| Year | Tax Paid | Tax Assessment Tax Assessment Total Assessment is a certain percentage of the fair market value that is determined by local assessors to be the total taxable value of land and additions on the property. | Land | Improvement |
|---|---|---|---|---|
| 2025 | $4,166 | $137,760 | $48,770 | $88,990 |
| 2024 | $4,044 | $137,760 | $48,770 | $88,990 |
| 2023 | $3,970 | $137,760 | $48,770 | $88,990 |
| 2022 | $3,892 | $137,760 | $48,770 | $88,990 |
| 2021 | $3,660 | $137,760 | $48,770 | $88,990 |
| 2020 | $3,581 | $137,760 | $48,770 | $88,990 |
| 2019 | $3,499 | $137,760 | $48,770 | $88,990 |
| 2018 | $3,431 | $137,760 | $48,770 | $88,990 |
| 2017 | $3,431 | $137,760 | $48,770 | $88,990 |
| 2016 | $0 | $137,760 | $48,770 | $88,990 |
| 2015 | -- | $137,760 | $48,770 | $88,990 |
| 2014 | -- | $137,760 | $48,770 | $88,990 |
Source: Public Records
Map
Nearby Homes
- 111 Lightfoot Ln
- 206 Eagle Rd
- Homesite 11 Old York Rd
- 49 Old York Rd
- 1160 Park Ave
- 4 Windy Ln
- TBB Old York Rd Unit EDGEWOOD II
- TBB Old York Rd Unit CARNEGIE II
- TBB Old York Rd Unit CRANBERRY
- TBB Old York Rd Unit WHITEHALL II
- Carnegie II Plan at Stony Run Single Family Homes
- Cranberry II Plan at Stony Run Single Family Homes
- Edgewood II Plan at Stony Run Single Family Homes
- Whitehall II Plan at Stony Run Single Family Homes
- York II Garage Plan at Stony Run Townhomes
- 15 Wargo Ln
- 51 Old York Rd
- 0 Mumper Ln
- 65 Clemens Dr
- 303 S Baltimore St