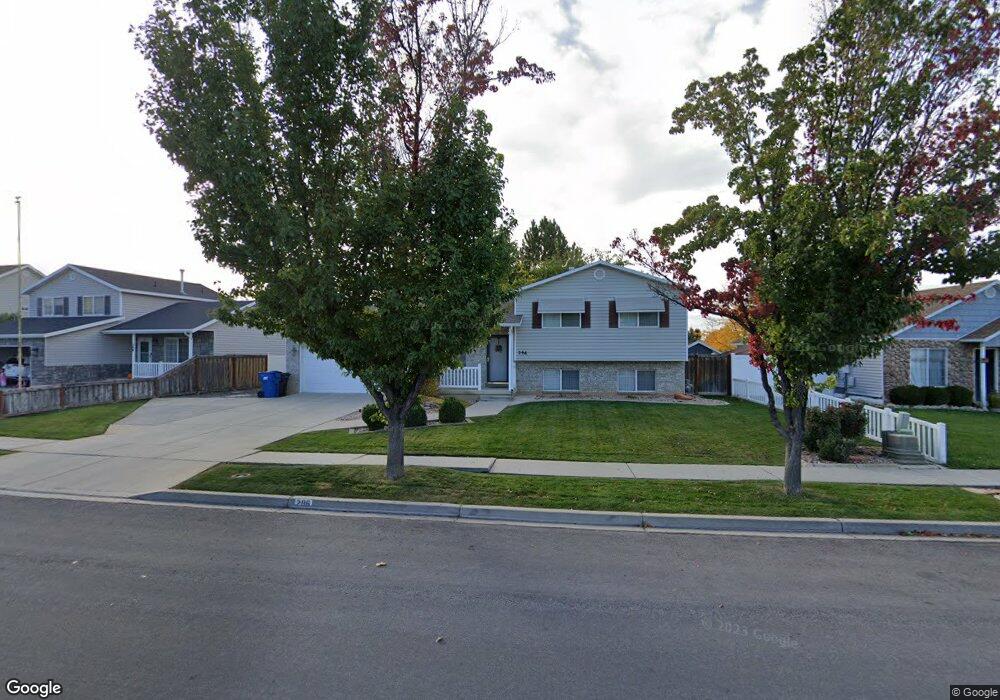
296 S 590 W Spanish Fork, UT 84660
Estimated Value: $409,000 - $464,925
3
Beds
3
Baths
1,542
Sq Ft
$290/Sq Ft
Est. Value
About This Home
This home is located at 296 S 590 W, Spanish Fork, UT 84660 and is currently estimated at $447,231, approximately $290 per square foot. 296 S 590 W is a home located in Utah County with nearby schools including Riverview Elementary School, Spanish Fork Jr High School, and Spanish Fork High School.
Ownership History
Date
Name
Owned For
Owner Type
Purchase Details
Closed on
Sep 16, 2013
Sold by
Nielson Brian T and Nielson Ruth Ellen
Bought by
Larson Kelly L and Larson Maria A
Current Estimated Value
Home Financials for this Owner
Home Financials are based on the most recent Mortgage that was taken out on this home.
Original Mortgage
$148,000
Outstanding Balance
$110,267
Interest Rate
4.36%
Mortgage Type
New Conventional
Estimated Equity
$336,964
Purchase Details
Closed on
Jul 3, 2000
Sold by
Salisbury Development Lc
Bought by
Nielson Brian T and Nielson Ruth Ellen
Home Financials for this Owner
Home Financials are based on the most recent Mortgage that was taken out on this home.
Original Mortgage
$121,150
Interest Rate
8.63%
Create a Home Valuation Report for This Property
The Home Valuation Report is an in-depth analysis detailing your home's value as well as a comparison with similar homes in the area
Home Values in the Area
Average Home Value in this Area
Purchase History
| Date | Buyer | Sale Price | Title Company |
|---|---|---|---|
| Larson Kelly L | -- | Provo Land Title Co | |
| Nielson Brian T | -- | Provo Land Title Company |
Source: Public Records
Mortgage History
| Date | Status | Borrower | Loan Amount |
|---|---|---|---|
| Open | Larson Kelly L | $148,000 | |
| Previous Owner | Nielson Brian T | $121,150 |
Source: Public Records
Tax History Compared to Growth
Tax History
| Year | Tax Paid | Tax Assessment Tax Assessment Total Assessment is a certain percentage of the fair market value that is determined by local assessors to be the total taxable value of land and additions on the property. | Land | Improvement |
|---|---|---|---|---|
| 2025 | $2,073 | $235,840 | $175,200 | $253,600 |
| 2024 | $2,073 | $213,620 | $0 | $0 |
| 2023 | $2,099 | $216,590 | $0 | $0 |
| 2022 | $2,198 | $222,475 | $0 | $0 |
| 2021 | $1,833 | $296,800 | $104,700 | $192,100 |
| 2020 | $1,745 | $274,700 | $95,200 | $179,500 |
| 2019 | $1,593 | $263,800 | $86,800 | $177,000 |
| 2018 | $1,484 | $237,600 | $79,900 | $157,700 |
| 2017 | $1,349 | $116,105 | $0 | $0 |
| 2016 | $1,277 | $108,460 | $0 | $0 |
| 2015 | $1,171 | $98,230 | $0 | $0 |
| 2014 | $1,143 | $96,250 | $0 | $0 |
Source: Public Records
Map
Nearby Homes
- 2645 W 360 S Unit 1
- 2576 W 360 S Unit 5
- 88 S 400 W
- 231 S 880 W
- 903 W 100 S
- 501 S 880 W
- 351 W 530 S
- 13 N 710 W
- 225 W 300 S
- 1026 W 350 S
- 1040 W Center St
- 324 S St Unit 204
- 956 W 40 N
- 1788 N 630 St W Unit 47
- 1826 N 630 St W Unit 101
- 298 S St Unit 205
- 325 S St Unit 203
- 333 S 1170 W
- 226 N 860 W Unit 156
- 134 N 300 W