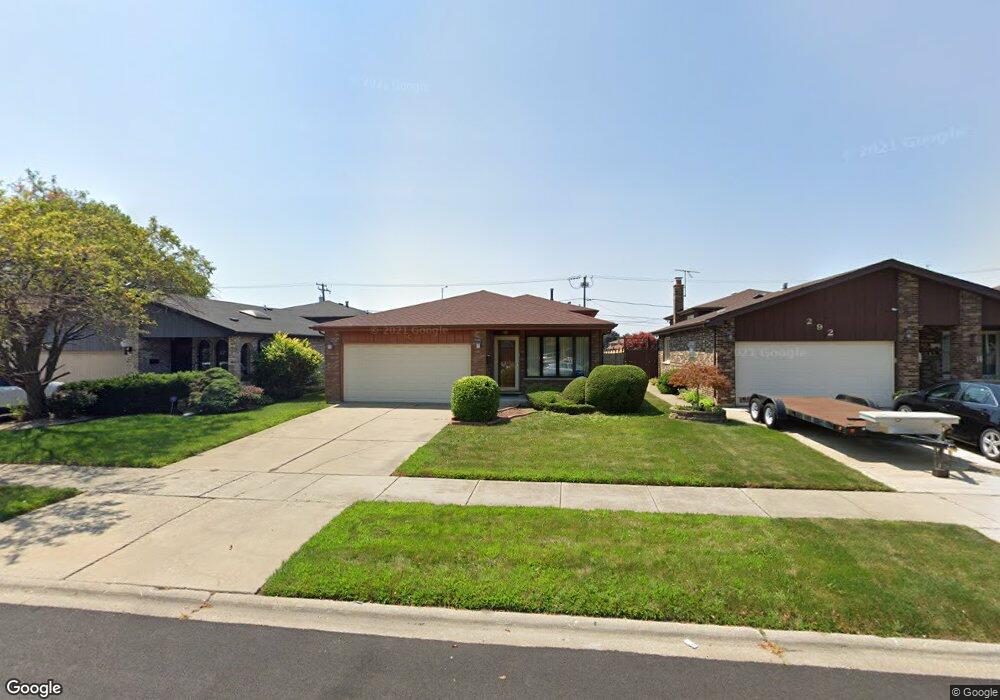
296 Saginaw Ave Calumet City, IL 60409
Estimated Value: $222,000 - $269,000
3
Beds
2
Baths
1,403
Sq Ft
$169/Sq Ft
Est. Value
About This Home
This home is located at 296 Saginaw Ave, Calumet City, IL 60409 and is currently estimated at $237,024, approximately $168 per square foot. 296 Saginaw Ave is a home located in Cook County with nearby schools including Wilson Elementary School, Wentworth Intermediate School, and Wentworth Jr High School.
Ownership History
Date
Name
Owned For
Owner Type
Purchase Details
Closed on
Sep 22, 2021
Sold by
Vinsen Geraldine and Vinsen Herdie
Bought by
Vinsen Geraldine
Current Estimated Value
Home Financials for this Owner
Home Financials are based on the most recent Mortgage that was taken out on this home.
Original Mortgage
$119,500
Outstanding Balance
$109,446
Interest Rate
3.25%
Mortgage Type
New Conventional
Estimated Equity
$127,578
Purchase Details
Closed on
Jan 5, 2001
Sold by
Vinsen Herdie and Vinsen Geraldine
Bought by
Vinsen Herdie and Vinsen Geraldine
Purchase Details
Closed on
Aug 23, 1993
Sold by
Sweet Terrance and Sweet Peggy A
Bought by
Vinson Pamela J
Home Financials for this Owner
Home Financials are based on the most recent Mortgage that was taken out on this home.
Original Mortgage
$95,000
Interest Rate
7.28%
Create a Home Valuation Report for This Property
The Home Valuation Report is an in-depth analysis detailing your home's value as well as a comparison with similar homes in the area
Home Values in the Area
Average Home Value in this Area
Purchase History
| Date | Buyer | Sale Price | Title Company |
|---|---|---|---|
| Vinsen Geraldine | -- | Attorney | |
| Vinsen Herdie | -- | Attorney | |
| Vinson Herdie | -- | -- | |
| Vinson Pamela J | -- | -- |
Source: Public Records
Mortgage History
| Date | Status | Borrower | Loan Amount |
|---|---|---|---|
| Open | Vinsen Geraldine | $119,500 | |
| Closed | Vinson Pamela J | $95,000 |
Source: Public Records
Tax History Compared to Growth
Tax History
| Year | Tax Paid | Tax Assessment Tax Assessment Total Assessment is a certain percentage of the fair market value that is determined by local assessors to be the total taxable value of land and additions on the property. | Land | Improvement |
|---|---|---|---|---|
| 2024 | $2,316 | $18,000 | $3,490 | $14,510 |
| 2023 | $2,990 | $18,000 | $3,490 | $14,510 |
| 2022 | $2,990 | $13,758 | $3,014 | $10,744 |
| 2021 | $2,800 | $13,756 | $3,013 | $10,743 |
| 2020 | $2,446 | $13,756 | $3,013 | $10,743 |
| 2019 | $2,842 | $12,026 | $2,538 | $9,488 |
| 2018 | $2,788 | $12,026 | $2,538 | $9,488 |
| 2017 | $2,647 | $12,026 | $2,538 | $9,488 |
| 2016 | $3,981 | $13,110 | $2,379 | $10,731 |
| 2015 | $4,108 | $13,110 | $2,379 | $10,731 |
| 2014 | $4,380 | $13,110 | $2,379 | $10,731 |
| 2013 | $3,664 | $14,451 | $2,379 | $12,072 |
Source: Public Records
Map
Nearby Homes
- 289 Saginaw Ave
- 281 Hoxie Ave
- 341 Saginaw Ave
- 327 Marquette Ave
- 14541 S Marquette Ave
- 286 Calhoun Ave
- 383 Calhoun Ave
- 2605 E Martha Place
- 412 Saginaw Ave
- 349 Yates Ave
- 372 Bensley Ave
- 353 Yates Ave
- 430 Marquette Ave
- 381 Yates Ave
- 1074 George St
- 453 Hoxie Ave
- 1613 Astor St Unit 1W
- 1613 Astor St Unit 16131E
- 14322 S Hoxie Ave
- 318 Campbell Ave
- 300 Saginaw Ave
- 292 Saginaw Ave
- 304 Saginaw Ave
- 288 Saginaw Ave
- 306 Saginaw Ave
- 286 Saginaw Ave
- 311 Torrence Ave
- 284 Saginaw Ave
- 299 Saginaw Ave
- 293 Saginaw Ave
- 303 Saginaw Ave
- 280 Saginaw Ave
- 287 Saginaw Ave
- 283 Torrence Ave
- 307 Saginaw Ave
- 307 Saginaw Ave
- 283 Saginaw Ave
- 279 Saginaw Ave
- 322 Saginaw Ave
- 319 Saginaw Ave