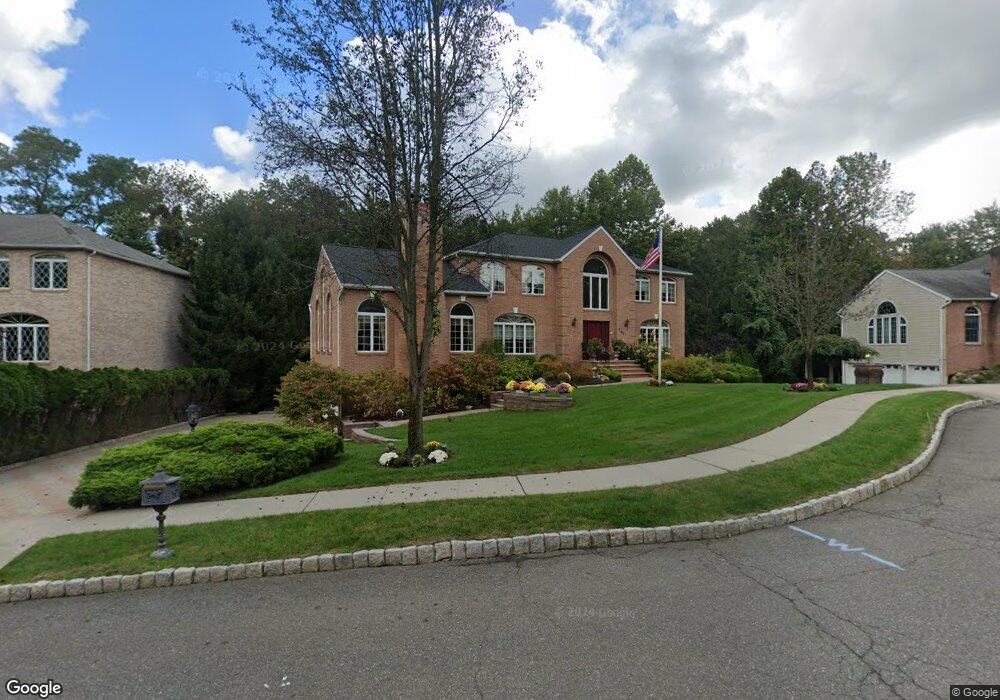
296 Skylark Ct Paramus, NJ 07652
Estimated Value: $1,372,000 - $1,683,000
Studio
--
Bath
3,344
Sq Ft
$451/Sq Ft
Est. Value
About This Home
This home is located at 296 Skylark Ct, Paramus, NJ 07652 and is currently estimated at $1,506,488, approximately $450 per square foot. 296 Skylark Ct is a home located in Bergen County with nearby schools including Paramus High School, Yeshivat Noam School, and Ridgewood Montessori School.
Ownership History
Date
Name
Owned For
Owner Type
Purchase Details
Closed on
Feb 27, 2008
Sold by
Maceri Maria
Bought by
Ghossn John and Maceri Maria
Current Estimated Value
Purchase Details
Closed on
Jun 28, 2001
Sold by
Macaluso Joseph
Bought by
Maceri Maria
Home Financials for this Owner
Home Financials are based on the most recent Mortgage that was taken out on this home.
Original Mortgage
$390,000
Interest Rate
7.18%
Purchase Details
Closed on
Sep 21, 2000
Bought by
Macaluso Joseph
Home Financials for this Owner
Home Financials are based on the most recent Mortgage that was taken out on this home.
Original Mortgage
$15,000
Interest Rate
7.7%
Purchase Details
Closed on
Jan 17, 1995
Sold by
La Associates
Bought by
Macaluso Joseph and Claydon Nancy
Home Financials for this Owner
Home Financials are based on the most recent Mortgage that was taken out on this home.
Original Mortgage
$375,000
Interest Rate
9.13%
Create a Home Valuation Report for This Property
The Home Valuation Report is an in-depth analysis detailing your home's value as well as a comparison with similar homes in the area
Home Values in the Area
Average Home Value in this Area
Purchase History
| Date | Buyer | Sale Price | Title Company |
|---|---|---|---|
| Ghossn John | -- | -- | |
| Maceri Maria | $780,000 | -- | |
| Macaluso Joseph | -- | -- | |
| Macaluso Joseph | -- | -- | |
| Macaluso Joseph | $400,000 | -- |
Source: Public Records
Mortgage History
| Date | Status | Borrower | Loan Amount |
|---|---|---|---|
| Previous Owner | Maceri Maria | $390,000 | |
| Previous Owner | Macaluso Joseph | $15,000 | |
| Previous Owner | Macaluso Joseph | $375,000 |
Source: Public Records
Tax History
| Year | Tax Paid | Tax Assessment Tax Assessment Total Assessment is a certain percentage of the fair market value that is determined by local assessors to be the total taxable value of land and additions on the property. | Land | Improvement |
|---|---|---|---|---|
| 2025 | $18,693 | $1,313,100 | $425,800 | $887,300 |
| 2024 | $18,156 | $1,234,700 | $394,100 | $840,600 |
| 2023 | $17,182 | $1,183,600 | $377,000 | $806,600 |
| 2022 | $17,182 | $1,107,100 | $351,400 | $755,700 |
| 2021 | $16,773 | $1,014,100 | $322,100 | $692,000 |
| 2020 | $15,979 | $985,100 | $317,300 | $667,800 |
| 2019 | $18,835 | $1,014,800 | $495,000 | $519,800 |
| 2018 | $18,601 | $1,014,800 | $495,000 | $519,800 |
| 2017 | $18,277 | $1,014,800 | $495,000 | $519,800 |
| 2016 | $17,779 | $1,014,800 | $495,000 | $519,800 |
| 2015 | $17,597 | $1,014,800 | $495,000 | $519,800 |
| 2014 | $17,444 | $1,014,800 | $495,000 | $519,800 |
Source: Public Records
Map
Nearby Homes
- 16-30 Saddle River Rd
- 47 Herold Dr
- 114 White Pine Ct
- 39-02 Taylor Rd
- 218 Mayfair Rd
- 496 Cedar Ln
- 11 Garvey Place
- 495 Paramus Rd
- 33 Beekman Place
- 232 W Midland Ave
- 11 Gabriel Ct
- 14 Gabriel Ct
- 24 Gabriel Ct
- 16 Gabriel Ct
- 4-21 Saddle River Rd
- 30-13 High St Unit 1X
- 17-09 Well Dr Unit 1X
- 26 Godwin Ave Unit 1X
- 491 Dorchester Rd
- 21 Manor Ct
- 300 Skylark Ct
- 292 Skylark Ct
- 297 Skylark Ct
- 290 Skylark Ct
- 301 Skylark Ct
- 293 Skylark Ct
- 263 Dunkerhook Rd
- 274 Dunkerhook Rd
- 267 Dunkerhook Rd
- 276 Dunkerhook Rd
- 273 Dunkerhook Rd
- 278 Dunkerhook Rd
- 331 Paramus Rd
- 277 Dunkerhook Rd
- 282 Dunkerhook Rd
- 337 Paramus Rd
- 284 Dunkerhook Rd
- 344 Paramus Rd
- 281 Dunkerhook Rd
- 283 Dunkerhook Rd
Your Personal Tour Guide
Ask me questions while you tour the home.