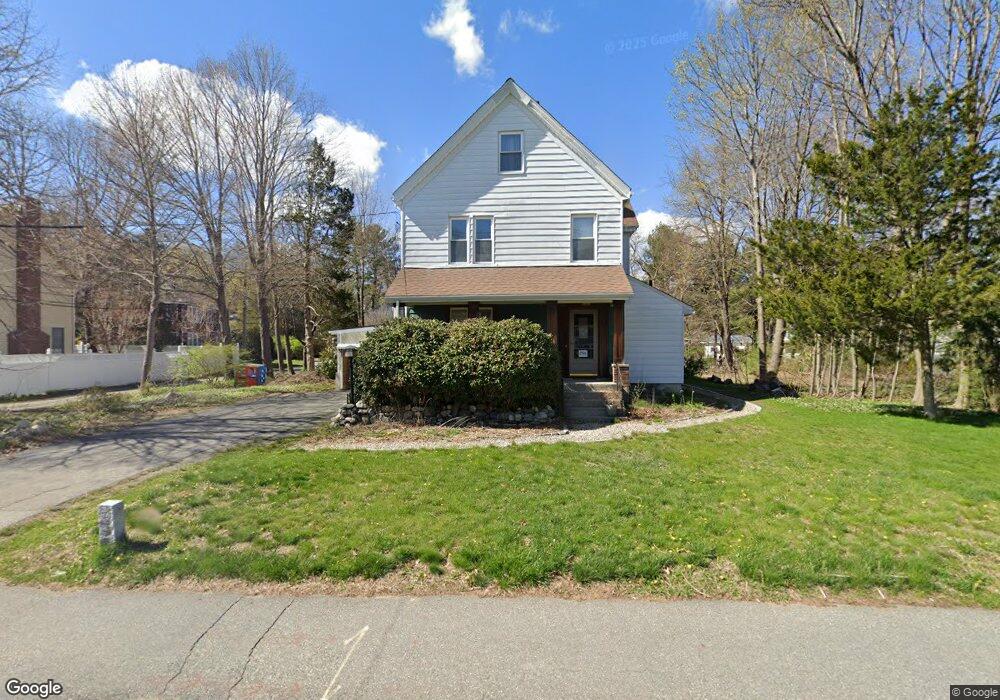
296 Woburn St Lexington, MA 02420
Countryside NeighborhoodEstimated Value: $1,143,219 - $1,415,000
3
Beds
3
Baths
2,003
Sq Ft
$642/Sq Ft
Est. Value
About This Home
This home is located at 296 Woburn St, Lexington, MA 02420 and is currently estimated at $1,286,555, approximately $642 per square foot. 296 Woburn St is a home located in Middlesex County with nearby schools including Harrington Elementary School, Jonas Clarke Middle School, and Lexington High School.
Ownership History
Date
Name
Owned For
Owner Type
Purchase Details
Closed on
Aug 19, 2003
Sold by
Regillo Norma T and Doyle Margherita
Bought by
Current Jane A
Current Estimated Value
Home Financials for this Owner
Home Financials are based on the most recent Mortgage that was taken out on this home.
Original Mortgage
$295,750
Outstanding Balance
$128,718
Interest Rate
5.46%
Mortgage Type
Purchase Money Mortgage
Estimated Equity
$1,157,837
Purchase Details
Closed on
May 2, 2003
Sold by
Navarroli Rt
Bought by
Doyle Margherita and Regillo Norma T
Create a Home Valuation Report for This Property
The Home Valuation Report is an in-depth analysis detailing your home's value as well as a comparison with similar homes in the area
Home Values in the Area
Average Home Value in this Area
Purchase History
| Date | Buyer | Sale Price | Title Company |
|---|---|---|---|
| Current Jane A | $455,000 | -- | |
| Doyle Margherita | -- | -- |
Source: Public Records
Mortgage History
| Date | Status | Borrower | Loan Amount |
|---|---|---|---|
| Open | Current Jane A | $295,750 |
Source: Public Records
Tax History Compared to Growth
Tax History
| Year | Tax Paid | Tax Assessment Tax Assessment Total Assessment is a certain percentage of the fair market value that is determined by local assessors to be the total taxable value of land and additions on the property. | Land | Improvement |
|---|---|---|---|---|
| 2025 | $12,548 | $1,026,000 | $596,000 | $430,000 |
| 2024 | $11,834 | $966,000 | $568,000 | $398,000 |
| 2023 | $11,427 | $879,000 | $516,000 | $363,000 |
| 2022 | $10,957 | $794,000 | $469,000 | $325,000 |
| 2021 | $0 | $756,000 | $447,000 | $309,000 |
| 2020 | $10,495 | $747,000 | $447,000 | $300,000 |
| 2019 | $3,630 | $713,000 | $425,000 | $288,000 |
| 2018 | $9,495 | $664,000 | $388,000 | $276,000 |
| 2017 | $9,505 | $656,000 | $378,000 | $278,000 |
| 2016 | $8,862 | $607,000 | $356,000 | $251,000 |
| 2015 | $8,396 | $565,000 | $323,000 | $242,000 |
| 2014 | $7,817 | $504,000 | $306,000 | $198,000 |
Source: Public Records
Map
Nearby Homes