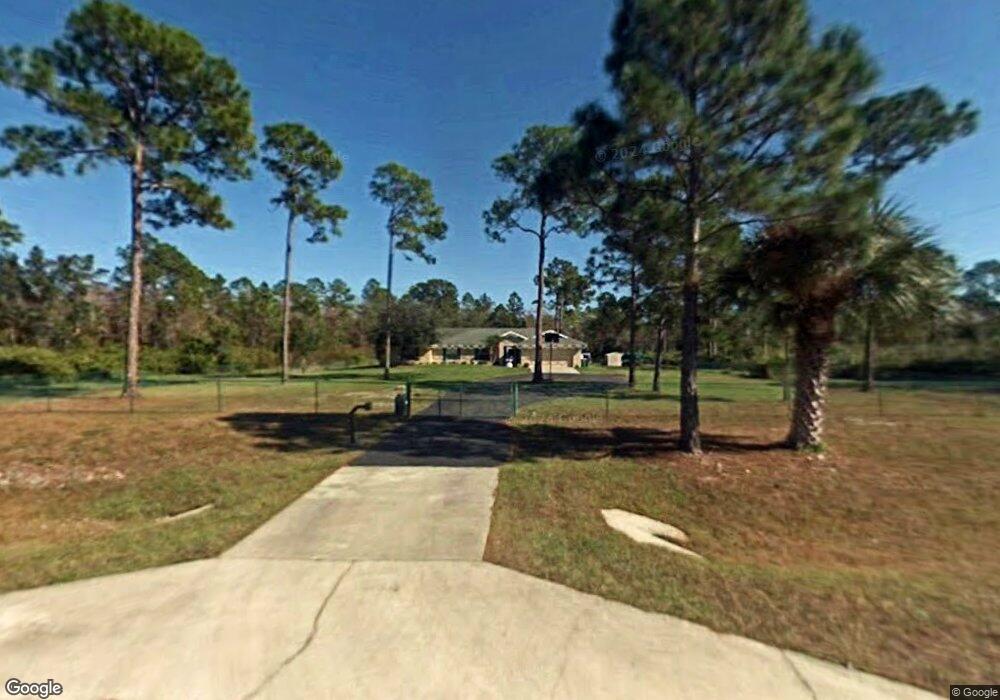
2960 2nd St NW Naples, FL 34120
Rural Estates NeighborhoodEstimated Value: $598,297 - $754,000
--
Bed
--
Bath
2,378
Sq Ft
$299/Sq Ft
Est. Value
About This Home
This home is located at 2960 2nd St NW, Naples, FL 34120 and is currently estimated at $711,574, approximately $299 per square foot. 2960 2nd St NW is a home located in Collier County with nearby schools including Corkscrew Elementary School, Corkscrew Middle School, and Gulf Coast High School.
Ownership History
Date
Name
Owned For
Owner Type
Purchase Details
Closed on
Nov 14, 2016
Sold by
Quality Homes Investments
Bought by
Chico Jose
Current Estimated Value
Home Financials for this Owner
Home Financials are based on the most recent Mortgage that was taken out on this home.
Original Mortgage
$363,298
Outstanding Balance
$293,037
Interest Rate
3.57%
Estimated Equity
$418,537
Purchase Details
Closed on
Mar 7, 2013
Sold by
Flinn Joseph D and Flinn Allison Alvarez
Bought by
Alvarez Flinn Allison and Alvarez Allison M
Purchase Details
Closed on
Jun 10, 2004
Sold by
Alvarez Flinn Allison and Flinn Joseph D
Bought by
Flinn Joseph D and Alvarez Flinn Allison
Home Financials for this Owner
Home Financials are based on the most recent Mortgage that was taken out on this home.
Original Mortgage
$250,000
Interest Rate
6.09%
Mortgage Type
New Conventional
Purchase Details
Closed on
Apr 7, 1995
Sold by
Case Margaret
Bought by
Milliken Allison J
Create a Home Valuation Report for This Property
The Home Valuation Report is an in-depth analysis detailing your home's value as well as a comparison with similar homes in the area
Home Values in the Area
Average Home Value in this Area
Purchase History
| Date | Buyer | Sale Price | Title Company |
|---|---|---|---|
| Chico Jose | -- | -- | |
| Alvarez Flinn Allison | -- | None Available | |
| Flinn Joseph D | -- | Collier Title Insurance Co | |
| Milliken Allison J | -- | -- | |
| Milliken Allison J | $9,000 | -- |
Source: Public Records
Mortgage History
| Date | Status | Borrower | Loan Amount |
|---|---|---|---|
| Open | Chico Jose | $363,298 | |
| Closed | Chico Jose | -- | |
| Previous Owner | Flinn Joseph D | $250,000 | |
| Previous Owner | Chico Jose | $180,500 | |
| Previous Owner | Chico Jose | $50,000 |
Source: Public Records
Tax History Compared to Growth
Tax History
| Year | Tax Paid | Tax Assessment Tax Assessment Total Assessment is a certain percentage of the fair market value that is determined by local assessors to be the total taxable value of land and additions on the property. | Land | Improvement |
|---|---|---|---|---|
| 2025 | $2,128 | $200,831 | -- | -- |
| 2024 | $2,109 | $195,171 | -- | -- |
| 2023 | $2,109 | $189,486 | $0 | $0 |
| 2022 | $2,112 | $183,967 | $0 | $0 |
| 2021 | $2,106 | $178,609 | $0 | $0 |
| 2020 | $2,058 | $176,143 | $0 | $0 |
| 2019 | $2,011 | $172,183 | $0 | $0 |
| 2018 | $1,930 | $168,973 | $0 | $0 |
| 2017 | $1,890 | $165,498 | $0 | $0 |
| 2016 | $1,829 | $162,094 | $0 | $0 |
| 2015 | $1,837 | $160,967 | $0 | $0 |
| 2014 | $1,836 | $109,689 | $0 | $0 |
Source: Public Records
Map
Nearby Homes
- 3068 2nd St NW
- 2791 2nd St NW
- 2719 2nd St NW
- 3011 2nd St NE
- 000 33rd Ave NW
- 219 33rd Ave NW
- 4XX 33rd Ave NW
- 398 35th Ave NW
- 0 35th Ave NE Unit 225067675
- 0 35th Ave NE Unit 223072569
- 209 35th Ave NW
- 3983 33rd Ave NE
- 2590 8th St NW
- 0 35th Ave NW Unit 224031344
- 0 35th Ave NW Unit 224018201
- 140 37th Ave NW
- 4xxx Wilson Blvd N
- 2680 2nd St NW
- 2920 2nd St NW
- 3022 2nd St NW
- 2991 2nd St NW
- 3040 2nd St NW
- 2880 2nd St NW
- 3021 2nd St NW
- 2860 2nd St NW
- 3070 2nd St NW
- 3051 2nd St NW
- 3080 2nd St NW
- 2875 2nd St NW
- 2971 Wilson Blvd N
- 2941 Wilson Blvd N
- 2840 2nd St NW
- 2921 Wilson Blvd N
- 3071 2nd St NW
- 3090 2nd St NW
- 2831 2nd St NW
- 3011 Wilson Blvd N