2960 E Sr 119 Richfield, UT 84701
Estimated Value: $260,000 - $340,000
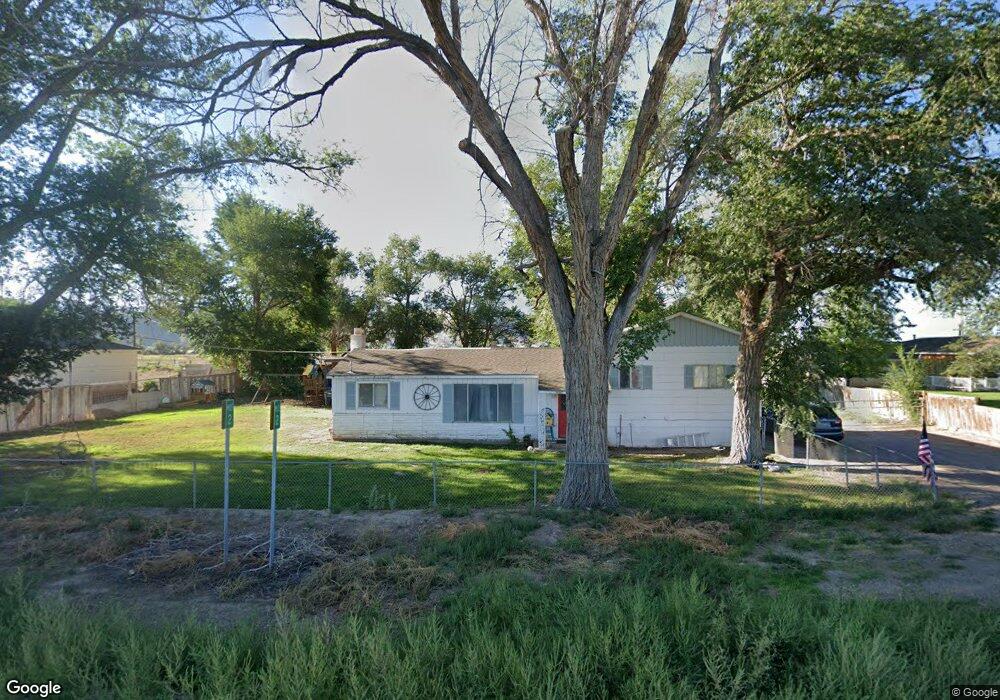
About This Home
This home is located at 2960 E Sr 119, Richfield, UT 84701 and is currently estimated at $301,224, approximately $196 per square foot. 2960 E Sr 119 is a home located in Sevier County with nearby schools including Pahvant School, Ashman School, and Red Hills Middle School.
Ownership History
We collect this data history from publicly available records. To have your information removed, we recommend requesting removal directly through your county’s website.
Purchase Details
Home Financials for this Owner
Home Financials are based on the most recent Mortgage that was taken out on this home.Purchase History
We collect this data history from publicly available records. To have your information removed, we recommend requesting removal directly through your county’s website.
| Date | Buyer | Sale Price | Title Company |
|---|---|---|---|
| -- | First American Title |
Mortgage History
We collect this data history from publicly available records. To have your information removed, we recommend requesting removal directly through your county’s website.
| Date | Status | Borrower | Loan Amount |
|---|---|---|---|
| Closed | $225,375 |
Tax History
We collect this data history from publicly available records. To have your information removed, we recommend requesting removal directly through your county’s website.
| Year | Tax Paid | Tax Assessment Tax Assessment Total Assessment is a certain percentage of the fair market value that is determined by local assessors to be the total taxable value of land and additions on the property. | Land | Improvement |
|---|---|---|---|---|
| 2025 | $1,126 | $128,988 | $47,158 | $81,830 |
| 2024 | $1,126 | $243,468 | $74,113 | $169,355 |
| 2023 | $2,073 | $256,091 | $67,376 | $188,715 |
| 2022 | $2,040 | $208,305 | $58,823 | $149,482 |
| 2021 | $1,961 | $168,384 | $41,726 | $126,658 |
| 2020 | $1,553 | $124,681 | $32,304 | $92,377 |
| 2019 | $1,374 | $117,820 | $32,300 | $85,520 |
| 2018 | $836 | $60,800 | $17,770 | $43,030 |
| 2017 | $774 | $53,310 | $14,810 | $38,500 |
| 2016 | $551 | $53,310 | $0 | $0 |
| 2015 | $551 | $48,560 | $0 | $0 |
| 2014 | $551 | $48,560 | $0 | $0 |
Map
- 931 N 2270 E
- 202 N Westhaven Rd
- 2890 N 2330 E Unit 1
- 638 E 200 N
- 1526 N Black Knoll Rd
- 56 S 500 E
- 342 N 500 E
- 662 E 300 N
- 145 N Venice Main St
- 442 E Center St
- 227 E 300 N
- 140 N 200 E
- 611 N 300 E
- 195 E 400 N
- 180 E 300 N
- 47 N 200 E
- 39 N 200 E
- 145 S 200 E
- 465 N Main St
- 0 Parcel #4-241-82 Unit 26-271167
Ask me questions while you tour the home.