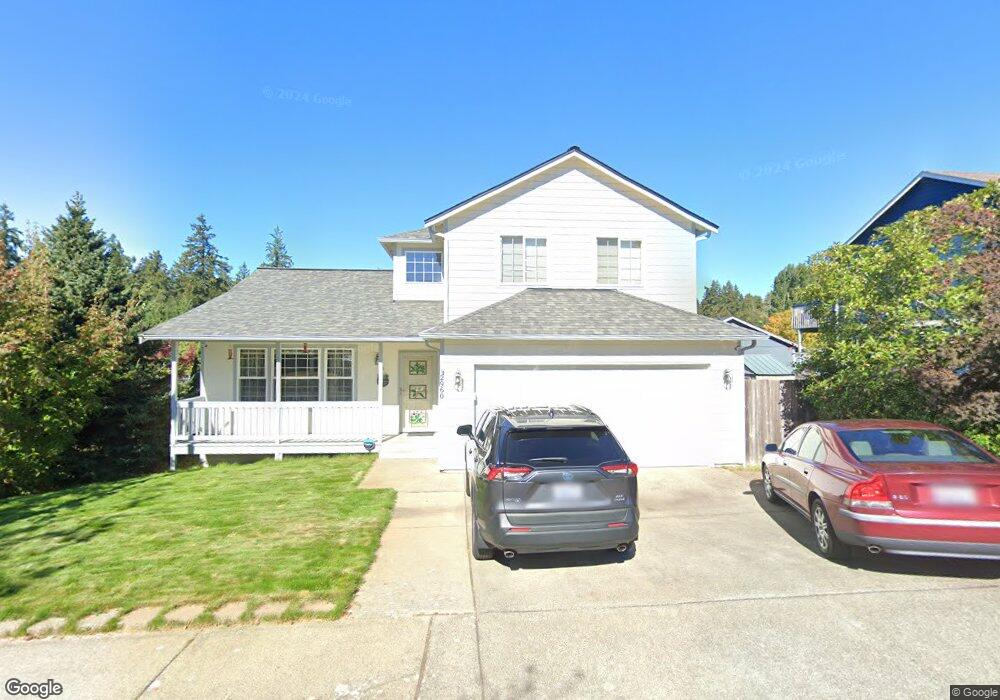
2960 Lowren Loop Port Orchard, WA 98366
Estimated Value: $491,535 - $524,000
3
Beds
3
Baths
1,781
Sq Ft
$285/Sq Ft
Est. Value
About This Home
This home is located at 2960 Lowren Loop, Port Orchard, WA 98366 and is currently estimated at $507,634, approximately $285 per square foot. 2960 Lowren Loop is a home located in Kitsap County with nearby schools including East Port Orchard Elementary School, Marcus Whitman Middle School, and South Kitsap High School.
Ownership History
Date
Name
Owned For
Owner Type
Purchase Details
Closed on
Sep 5, 2018
Sold by
Franklin Richard A and Franklin Terry A
Bought by
Franklin Richard A and Franklin Terry A
Current Estimated Value
Purchase Details
Closed on
Feb 9, 2001
Sold by
Grice Corp Inc
Bought by
Franklin Richard A and Franklin Terry A
Home Financials for this Owner
Home Financials are based on the most recent Mortgage that was taken out on this home.
Original Mortgage
$147,290
Outstanding Balance
$53,203
Interest Rate
7.08%
Mortgage Type
VA
Estimated Equity
$454,431
Create a Home Valuation Report for This Property
The Home Valuation Report is an in-depth analysis detailing your home's value as well as a comparison with similar homes in the area
Home Values in the Area
Average Home Value in this Area
Purchase History
| Date | Buyer | Sale Price | Title Company |
|---|---|---|---|
| Franklin Richard A | -- | None Available | |
| Franklin Richard A | $143,000 | Transnation Title Insurance |
Source: Public Records
Mortgage History
| Date | Status | Borrower | Loan Amount |
|---|---|---|---|
| Open | Franklin Richard A | $147,290 |
Source: Public Records
Tax History Compared to Growth
Tax History
| Year | Tax Paid | Tax Assessment Tax Assessment Total Assessment is a certain percentage of the fair market value that is determined by local assessors to be the total taxable value of land and additions on the property. | Land | Improvement |
|---|---|---|---|---|
| 2026 | $3,813 | $446,920 | $60,930 | $385,990 |
| 2025 | $3,813 | $436,980 | $57,350 | $379,630 |
| 2024 | $3,681 | $436,980 | $57,350 | $379,630 |
| 2023 | $3,678 | $436,980 | $57,350 | $379,630 |
| 2022 | $3,584 | $358,450 | $53,560 | $304,890 |
| 2021 | $3,328 | $315,510 | $49,770 | $265,740 |
| 2020 | $3,270 | $300,660 | $47,400 | $253,260 |
| 2019 | $2,714 | $273,200 | $46,540 | $226,660 |
| 2018 | $2,827 | $219,030 | $46,540 | $172,490 |
| 2017 | $2,400 | $219,030 | $46,540 | $172,490 |
| 2016 | $2,306 | $194,790 | $46,540 | $148,250 |
| 2015 | $2,219 | $190,520 | $46,540 | $143,980 |
| 2014 | -- | $187,670 | $46,540 | $141,130 |
| 2013 | -- | $195,970 | $48,990 | $146,980 |
Source: Public Records
Map
Nearby Homes
- 2949 SE Mile Hill Dr Unit C-2
- 123 E 4th St
- 4990 Mile Hill Dr
- 190 SE Mile Hill Dr
- 0 Wendell Ave SE
- 3817 SE Horstman Rd
- 3140 E Washington St
- 22 Lots E Washington St
- 0 E Washington St Unit NWM2337936
- 3589 SE Pine Tree Dr
- 0 Beach Dr E Unit NWM2448019
- 0 Beach Dr E Unit NWM2139946
- 343 Farragut Ave N
- 1663 Harrison Ave SE
- 1703 Harrison Ave SE
- 3900 SE Mile Hill Dr
- 4010 SE Lovell St
- 130 Mitchell Ave
- 3930 SE Mile Hill Dr
- 4 SE Sinclair View Dr
- 2956 Lowren Loop
- 2970 Lowren Loop
- 2961 Lowren Loop
- 2971 Lowren Loop
- 2969 Lowren Loop
- 2990 Lowren Loop
- 2959 Lowren Loop
- 2965 Lowren Loop
- 2988 Lowren Loop
- 2977 Lowren Loop
- 2980 Lowren Loop
- 2983 Sprague St
- 2957 Lowren Loop
- 2985 Sprague St
- 2973 Lowren Loop
- 2979 Lowren Loop
- 2981 Sprague St
- 2992 Lowren Loop
- 2987 Sprague St