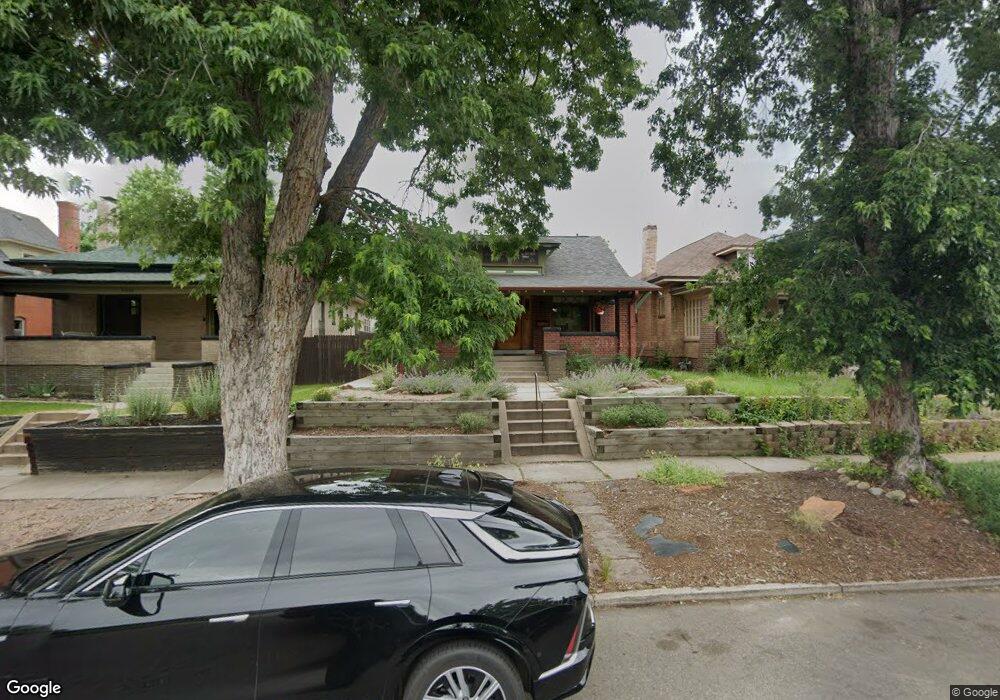
2961 Grove St Denver, CO 80211
West Highland NeighborhoodEstimated Value: $864,151 - $961,000
2
Beds
3
Baths
1,363
Sq Ft
$655/Sq Ft
Est. Value
About This Home
This home is located at 2961 Grove St, Denver, CO 80211 and is currently estimated at $893,038, approximately $655 per square foot. 2961 Grove St is a home located in Denver County with nearby schools including Edison Elementary School, Bryant Webster Dual Language School, and Skinner Middle School.
Ownership History
Date
Name
Owned For
Owner Type
Purchase Details
Closed on
Nov 2, 2015
Sold by
Hammel Lucinda Sue and Hammel Lucinda
Bought by
Lucinda S Hammel Trust
Current Estimated Value
Purchase Details
Closed on
Oct 20, 2012
Sold by
Hammel Lucinda Sue and Lubbert Timothy Edward
Bought by
Hammel Lucinda Sue
Purchase Details
Closed on
Feb 22, 2002
Sold by
Hammel Lucinda Sue
Bought by
Hammel Lucinda and Lubbert Timothy
Home Financials for this Owner
Home Financials are based on the most recent Mortgage that was taken out on this home.
Original Mortgage
$90,000
Outstanding Balance
$36,424
Interest Rate
6.76%
Mortgage Type
Credit Line Revolving
Estimated Equity
$856,614
Purchase Details
Closed on
Sep 29, 1995
Sold by
Williamson Steven Edward and Okeefe Margaret Ann
Bought by
Hammel Lucinda Sue
Home Financials for this Owner
Home Financials are based on the most recent Mortgage that was taken out on this home.
Original Mortgage
$109,600
Interest Rate
7.84%
Create a Home Valuation Report for This Property
The Home Valuation Report is an in-depth analysis detailing your home's value as well as a comparison with similar homes in the area
Home Values in the Area
Average Home Value in this Area
Purchase History
| Date | Buyer | Sale Price | Title Company |
|---|---|---|---|
| Lucinda S Hammel Trust | -- | None Available | |
| Hammel Lucinda Sue | -- | None Available | |
| Hammel Lucinda | -- | -- | |
| Hammel Lucinda Sue | $137,000 | -- |
Source: Public Records
Mortgage History
| Date | Status | Borrower | Loan Amount |
|---|---|---|---|
| Open | Hammel Lucinda | $90,000 | |
| Closed | Hammel Lucinda Sue | $109,600 |
Source: Public Records
Tax History Compared to Growth
Tax History
| Year | Tax Paid | Tax Assessment Tax Assessment Total Assessment is a certain percentage of the fair market value that is determined by local assessors to be the total taxable value of land and additions on the property. | Land | Improvement |
|---|---|---|---|---|
| 2024 | $4,561 | $57,590 | $33,430 | $24,160 |
| 2023 | $4,462 | $57,590 | $33,430 | $24,160 |
| 2022 | $4,146 | $52,130 | $31,500 | $20,630 |
| 2021 | $4,001 | $53,620 | $32,400 | $21,220 |
| 2020 | $3,625 | $48,860 | $27,010 | $21,850 |
| 2019 | $3,524 | $48,860 | $27,010 | $21,850 |
| 2018 | $2,950 | $38,130 | $21,760 | $16,370 |
| 2017 | $2,941 | $38,130 | $21,760 | $16,370 |
| 2016 | $2,928 | $35,910 | $18,037 | $17,873 |
| 2015 | $2,806 | $35,910 | $18,037 | $17,873 |
| 2014 | $2,565 | $30,880 | $12,951 | $17,929 |
Source: Public Records
Map
Nearby Homes
- 3214 W Hayward Place
- 2849 Hazel Ct
- 3050 W 32nd Ave Unit 102C
- 3050 W 32nd Ave Unit 202C
- 3168 W 29th Ave
- 3116 W 32nd Ave
- 2975 Irving St
- 2925 Irving St
- 3127 W 28th Ave Unit 2
- 2751 Hazel Ct
- 2900 W 32nd Ave
- 2827 Eliot St Unit 1
- 2854 Eliot St
- 2730 Hooker St
- 2830 W 32nd Ave
- 3358 W 32nd Ave
- 2718 Hooker St
- 3362 W 32nd Ave
- 2726 Federal Blvd Unit 1
- 2726 Federal Blvd Unit 3