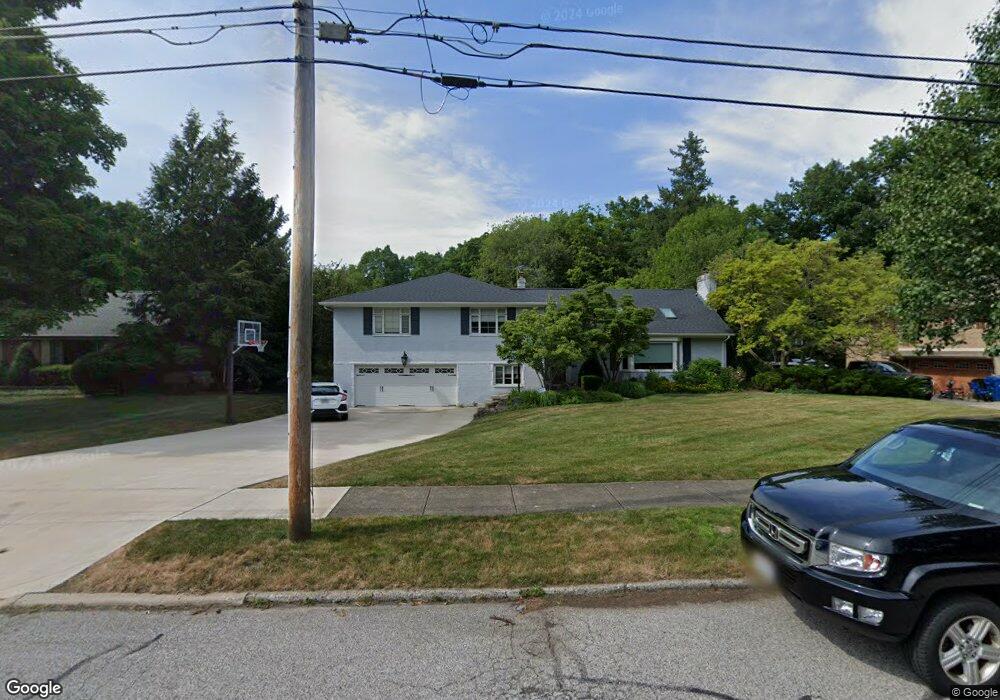
29614 W Oakland Rd Bay Village, OH 44140
Estimated Value: $695,000 - $852,000
5
Beds
4
Baths
3,761
Sq Ft
$198/Sq Ft
Est. Value
About This Home
This home is located at 29614 W Oakland Rd, Bay Village, OH 44140 and is currently estimated at $746,343, approximately $198 per square foot. 29614 W Oakland Rd is a home located in Cuyahoga County with nearby schools including Westerly Elementary School, Normandy Elementary School, and Bay Middle School.
Ownership History
Date
Name
Owned For
Owner Type
Purchase Details
Closed on
May 31, 2001
Sold by
Wilkens Karl F
Bought by
Wilkens Julie D
Current Estimated Value
Purchase Details
Closed on
Jul 3, 1999
Sold by
Reilly Joseph F and Reilly Nancy L
Bought by
Wilkens Kent F and Wilkens Julies D
Home Financials for this Owner
Home Financials are based on the most recent Mortgage that was taken out on this home.
Original Mortgage
$172,500
Interest Rate
7.28%
Purchase Details
Closed on
Jul 10, 1996
Sold by
O'Donnell Harold M
Bought by
Reilly Joseph F and Reilly Nancy L
Purchase Details
Closed on
Oct 2, 1992
Sold by
Knudsen Herbert D
Bought by
Odonnell Harold M
Purchase Details
Closed on
May 17, 1976
Sold by
Norris Donald A and Norris Rosemary
Bought by
Knudsen Herbert D
Purchase Details
Closed on
Jan 1, 1975
Bought by
Norris Donald A and Norris Rosemary
Create a Home Valuation Report for This Property
The Home Valuation Report is an in-depth analysis detailing your home's value as well as a comparison with similar homes in the area
Home Values in the Area
Average Home Value in this Area
Purchase History
| Date | Buyer | Sale Price | Title Company |
|---|---|---|---|
| Wilkens Julie D | -- | -- | |
| Wilkens Kent F | $259,000 | Hearthland Title & Escrow Ag | |
| Reilly Joseph F | $228,000 | -- | |
| Odonnell Harold M | $187,000 | -- | |
| Knudsen Herbert D | $94,500 | -- | |
| Norris Donald A | -- | -- |
Source: Public Records
Mortgage History
| Date | Status | Borrower | Loan Amount |
|---|---|---|---|
| Previous Owner | Wilkens Kent F | $172,500 | |
| Closed | Reilly Joseph F | -- |
Source: Public Records
Tax History Compared to Growth
Tax History
| Year | Tax Paid | Tax Assessment Tax Assessment Total Assessment is a certain percentage of the fair market value that is determined by local assessors to be the total taxable value of land and additions on the property. | Land | Improvement |
|---|---|---|---|---|
| 2024 | $13,093 | $203,000 | $41,300 | $161,700 |
| 2023 | $11,724 | $155,720 | $28,810 | $126,910 |
| 2022 | $11,702 | $155,720 | $28,810 | $126,910 |
| 2021 | $10,604 | $155,720 | $28,810 | $126,910 |
| 2020 | $9,619 | $128,630 | $24,010 | $104,620 |
| 2019 | $9,339 | $367,500 | $68,600 | $298,900 |
| 2018 | $8,358 | $128,630 | $24,010 | $104,620 |
| 2017 | $8,006 | $102,310 | $21,600 | $80,710 |
| 2016 | $7,916 | $101,650 | $21,600 | $80,050 |
| 2015 | $7,063 | $101,650 | $21,600 | $80,050 |
| 2014 | $7,063 | $94,120 | $19,990 | $74,130 |
Source: Public Records
Map
Nearby Homes
- 29806 Osborn Rd
- 433 Bassett Rd
- 29305 Osborn Rd
- 589 Debbington Dr
- 30200 Westlawn Dr
- 584 Wildbrook Dr
- 382 Bassett Rd
- 625 Bassett Rd
- 340 Bassett Rd
- 624 Millard Dr
- 30611 Winston Dr
- 28205 W Oviatt Rd
- 27870 Birchwood Ct
- 841 S Parkside Dr
- 879 S Parkside Dr
- 27841 Birchwood Ct
- 381 Bates Dr
- 552 Marvis Dr
- 30907 Arlington Cir
- 31302 Walker Rd
- 29622 W Oakland Rd
- 29604 W Oakland Rd
- 29700 W Oakland Rd
- 29602 W Oakland Rd
- 29617 W Oakland Rd
- 29706 W Oakland Rd
- 29611 W Oakland Rd
- 29623 W Oakland Rd
- 29605 W Oakland Rd
- 29701 W Oakland Rd
- 29510 W Oakland Rd
- 29603 W Oakland Rd
- 29712 W Oakland Rd
- 29709 W Oakland Rd
- 29621 Wolf Rd
- 29601 Wolf Rd
- 29629 Wolf Rd
- 29506 W Oakland Rd
- 29611 Wolf Rd
- 29800 W Oakland Rd