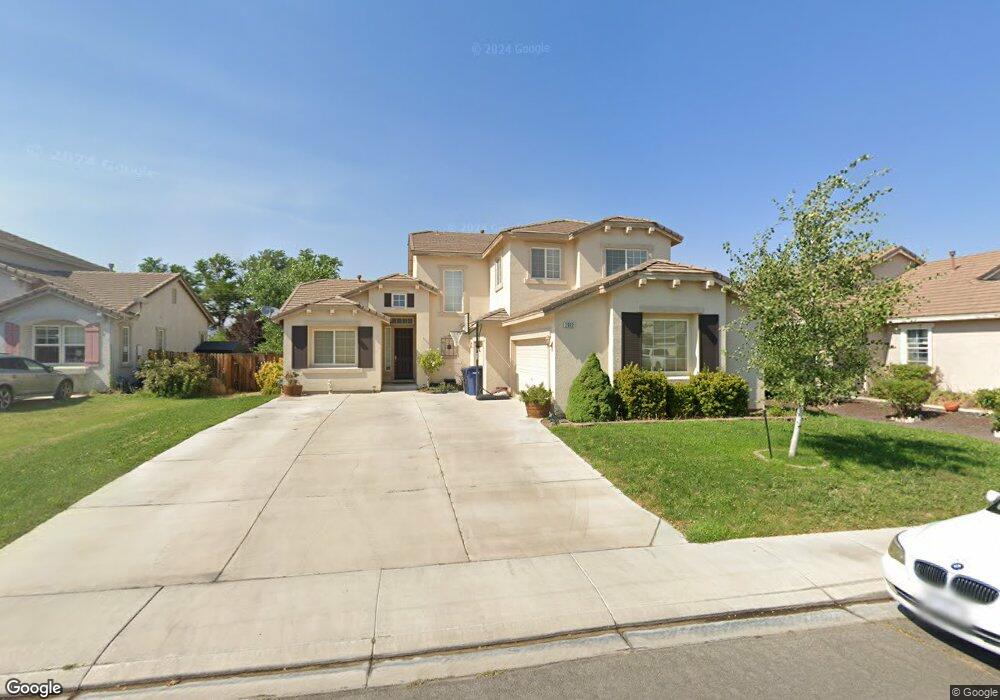
2962 N Fork Rd Fernley, NV 89408
Estimated Value: $518,482 - $600,000
4
Beds
3
Baths
2,860
Sq Ft
$196/Sq Ft
Est. Value
About This Home
This home is located at 2962 N Fork Rd, Fernley, NV 89408 and is currently estimated at $561,371, approximately $196 per square foot. 2962 N Fork Rd is a home located in Lyon County with nearby schools including East Valley Elementary School, Fernley Intermediate School, and Fernley High School.
Ownership History
Date
Name
Owned For
Owner Type
Purchase Details
Closed on
Feb 17, 2022
Sold by
Dumont Gary W and Dumont Monica C
Bought by
Dumont Revocable Trust
Current Estimated Value
Purchase Details
Closed on
Apr 28, 2008
Sold by
Carter Ben L and Carter Lanette M
Bought by
Dumont Gary W and Dumont Monica C
Home Financials for this Owner
Home Financials are based on the most recent Mortgage that was taken out on this home.
Original Mortgage
$325,395
Interest Rate
5.99%
Mortgage Type
VA
Purchase Details
Closed on
Jun 13, 2005
Sold by
R & K Homes River Ranch
Bought by
Carter Ben L and Carter Lanette M
Home Financials for this Owner
Home Financials are based on the most recent Mortgage that was taken out on this home.
Original Mortgage
$243,900
Interest Rate
5.56%
Mortgage Type
New Conventional
Create a Home Valuation Report for This Property
The Home Valuation Report is an in-depth analysis detailing your home's value as well as a comparison with similar homes in the area
Home Values in the Area
Average Home Value in this Area
Purchase History
| Date | Buyer | Sale Price | Title Company |
|---|---|---|---|
| Dumont Revocable Trust | -- | None Listed On Document | |
| Dumont Gary W | $316,000 | Western Title Company Inc | |
| Carter Ben L | $304,879 | Title Service & Escrow Co |
Source: Public Records
Mortgage History
| Date | Status | Borrower | Loan Amount |
|---|---|---|---|
| Previous Owner | Dumont Gary W | $325,395 | |
| Previous Owner | Carter Ben L | $243,900 |
Source: Public Records
Tax History Compared to Growth
Tax History
| Year | Tax Paid | Tax Assessment Tax Assessment Total Assessment is a certain percentage of the fair market value that is determined by local assessors to be the total taxable value of land and additions on the property. | Land | Improvement |
|---|---|---|---|---|
| 2025 | $1,459 | $120,383 | $33,250 | $122,533 |
| 2024 | $1,825 | $121,658 | $33,250 | $122,808 |
| 2023 | $3,012 | $148,391 | $33,250 | $115,141 |
| 2022 | $2,046 | $138,733 | $33,250 | $105,483 |
| 2021 | $2,048 | $125,873 | $23,100 | $102,773 |
| 2020 | $1,984 | $122,192 | $23,100 | $99,092 |
| 2019 | $1,954 | $114,730 | $19,250 | $95,480 |
| 2018 | $1,918 | $107,450 | $14,350 | $93,100 |
| 2017 | $1,902 | $102,656 | $9,630 | $93,026 |
| 2016 | $1,702 | $81,975 | $6,300 | $75,675 |
| 2015 | $2,009 | $65,248 | $6,300 | $58,948 |
| 2014 | $1,965 | $54,697 | $6,300 | $48,397 |
Source: Public Records
Map
Nearby Homes
- 1357 Horse Creek Way
- 3299 Hadley St Unit Lot 62
- 3297 Hadley St Unit Lot 61
- 6778 Shell Ct
- 3292 Hadley St Unit Lot 66
- 141 Country Ranch Rd
- 3458 Payton Way Unit Lot 100
- 3449 Payton Way Unit Lot 110
- 3457 Payton Way
- 3462 Payton Way Unit Lot 98
- 3274 Eleanor Way
- 2880 Horseshoe Ln
- 7785 Desert Shadows Ln
- 1194 Jasmine Ln
- 611 Annie Way
- 132 Campfire Cir
- 3480 Drayer Ln
- 1063 Pepper Ln Unit 192
- 0 Nevada Pacific Blvd
- 1373 Nevada Pacific Blvd
- 2964 N Fork Rd
- 2960 N Fork Rd
- 2958 N Fork Rd
- 2966 N Fork Rd
- 2961 N Fork Rd
- 2963 N Fork Rd
- 2959 N Fork Rd
- 2968 N Fork Rd
- 2965 N Fork Rd
- 2965 N Fork Rd Unit Fernley
- 2954 N Fork Rd
- 1353 Horse Creek Way
- 2970 N Fork Rd
- 2970 N Fork Rd Unit Rd
- 1350 Horse Creek Way
- 2944 Walker Ct
- 1352 Horse Creek Way
- 2969 N Fork Rd
- 2952 N Fork Rd
- 2972 N Fork Rd