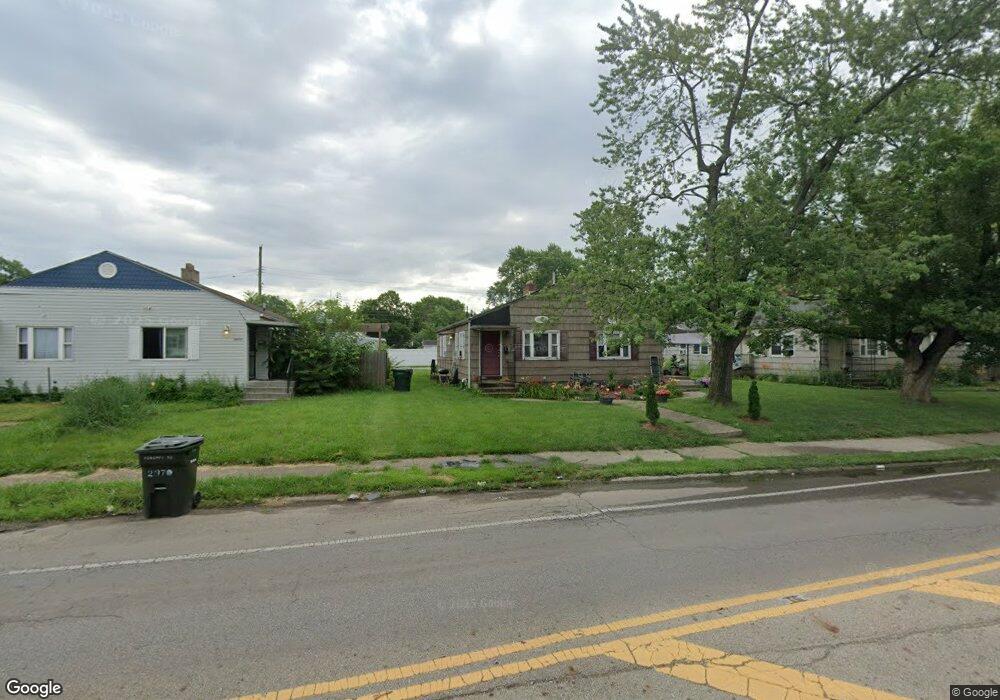
2964 McGuffey Rd Unit 66 Columbus, OH 43224
North Linden NeighborhoodEstimated Value: $174,156 - $219,000
4
Beds
2
Baths
1,576
Sq Ft
$125/Sq Ft
Est. Value
About This Home
This home is located at 2964 McGuffey Rd Unit 66, Columbus, OH 43224 and is currently estimated at $197,539, approximately $125 per square foot. 2964 McGuffey Rd Unit 66 is a home located in Franklin County with nearby schools including Como Elementary School, Dominion Middle School, and Whetstone High School.
Ownership History
Date
Name
Owned For
Owner Type
Purchase Details
Closed on
Sep 11, 2014
Sold by
Dranichak Properties Ii Llc
Bought by
Dranichak Michael
Current Estimated Value
Purchase Details
Closed on
Jul 10, 2014
Sold by
Jackson Adam
Bought by
Dranichak Properties Ii Llc
Purchase Details
Closed on
Mar 30, 2006
Sold by
Mahoney Patrick and Mahoney Betty R
Bought by
Jackson Adam
Home Financials for this Owner
Home Financials are based on the most recent Mortgage that was taken out on this home.
Original Mortgage
$85,999
Interest Rate
8.52%
Mortgage Type
Fannie Mae Freddie Mac
Purchase Details
Closed on
Mar 28, 2006
Sold by
Mahoney John A
Bought by
Mahoney Patrick
Home Financials for this Owner
Home Financials are based on the most recent Mortgage that was taken out on this home.
Original Mortgage
$85,999
Interest Rate
8.52%
Mortgage Type
Fannie Mae Freddie Mac
Purchase Details
Closed on
Mar 1, 1985
Purchase Details
Closed on
May 1, 1983
Create a Home Valuation Report for This Property
The Home Valuation Report is an in-depth analysis detailing your home's value as well as a comparison with similar homes in the area
Home Values in the Area
Average Home Value in this Area
Purchase History
| Date | Buyer | Sale Price | Title Company |
|---|---|---|---|
| Dranichak Michael | $31,000 | None Available | |
| Dranichak Properties Ii Llc | -- | -- | |
| Jackson Adam | $862,600 | Trident Tit | |
| Mahoney Patrick | $441,000 | Trident Tit | |
| -- | -- | -- | |
| -- | -- | -- |
Source: Public Records
Mortgage History
| Date | Status | Borrower | Loan Amount |
|---|---|---|---|
| Previous Owner | Jackson Adam | $85,999 | |
| Previous Owner | Mahoney Patrick | $85,999 |
Source: Public Records
Tax History
| Year | Tax Paid | Tax Assessment Tax Assessment Total Assessment is a certain percentage of the fair market value that is determined by local assessors to be the total taxable value of land and additions on the property. | Land | Improvement |
|---|---|---|---|---|
| 2025 | $2,219 | $48,410 | $12,850 | $35,560 |
| 2024 | $2,219 | $48,410 | $12,850 | $35,560 |
| 2023 | $2,191 | $48,405 | $12,845 | $35,560 |
| 2022 | $1,894 | $35,640 | $5,780 | $29,860 |
| 2021 | $1,897 | $35,640 | $5,780 | $29,860 |
| 2020 | $1,900 | $35,640 | $5,780 | $29,860 |
| 2019 | $1,848 | $29,720 | $4,830 | $24,890 |
| 2018 | $1,031 | $17,470 | $4,830 | $12,640 |
| 2017 | $1,125 | $17,470 | $4,830 | $12,640 |
| 2016 | $1,163 | $17,120 | $4,060 | $13,060 |
| 2015 | $977 | $7,320 | $4,060 | $3,260 |
| 2014 | $454 | $7,320 | $4,060 | $3,260 |
| 2013 | $1,099 | $25,830 | $4,795 | $21,035 |
Source: Public Records
Map
Nearby Homes
- 2950 Grasmere Ave
- 2992 Howey Rd
- 2897 Grasmere Ave
- 2874 Grasmere Ave
- 2916 Hamilton Ave
- 2888 Howey Rd
- 3081 Grasmere Ave
- 2872 Howey Rd
- 1222 Manchester Ave
- 3147 Grasmere Ave
- 1311 E Weber Rd
- 964 E Weber Rd
- 1303 Oakland Park Ave
- 1166 Minnesota Ave
- 2890 Medina Ave
- 1199 Minnesota Ave
- 3056 Medina Ave
- 1398 Manchester Ave
- 2819 Norwood St
- 3035 Audubon Rd
- 2970 McGuffey Rd
- 2956 McGuffey Rd Unit 58
- 1195 Sandlin Ave
- 2948 McGuffey Rd Unit 50
- 1188 Delno Ave
- 1201 Sandlin Ave
- 2988 McGuffey Rd
- 1194 Delno Ave
- 2965-2967 McGuffey Rd
- 2963 McGuffey Rd
- 2965 McGuffey Rd Unit 967
- 2971 McGuffey Rd
- 2957 McGuffey Rd
- 2957 McGuffey Rd Unit 10-
- 1207 Sandlin Ave
- 2977 McGuffey Rd
- 1194 Sandlin Ave
- 1200 Delno Ave
- 2994 McGuffey Rd
- 2932 McGuffey Rd Unit 34
Your Personal Tour Guide
Ask me questions while you tour the home.