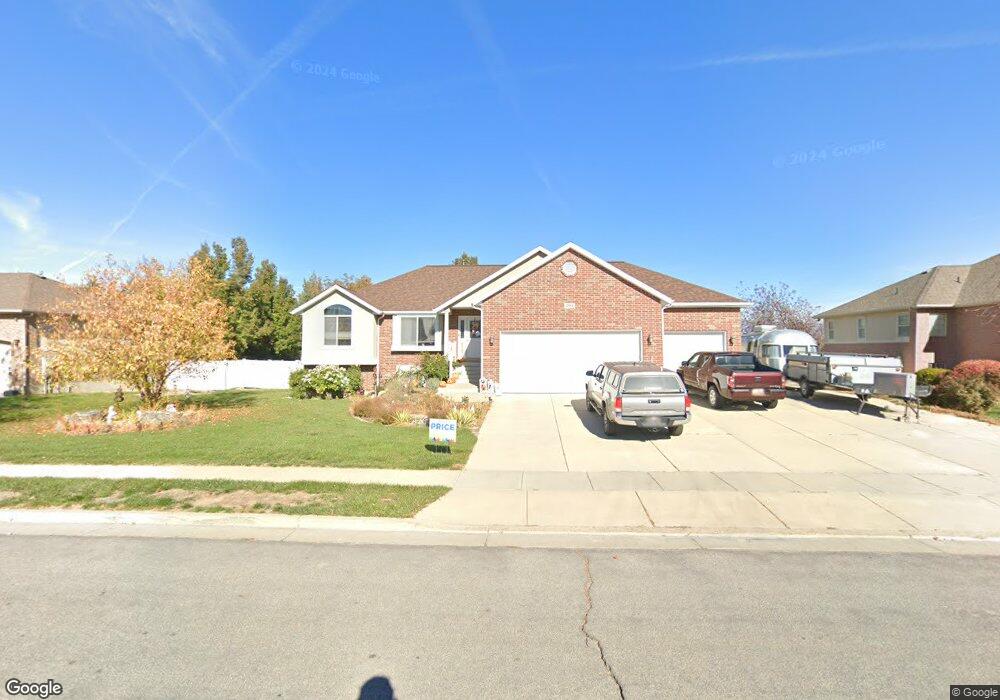
2964 W 1010 N Clearfield, UT 84015
Estimated Value: $598,790 - $709,000
5
Beds
3
Baths
3,281
Sq Ft
$194/Sq Ft
Est. Value
About This Home
This home is located at 2964 W 1010 N, Clearfield, UT 84015 and is currently estimated at $634,948, approximately $193 per square foot. 2964 W 1010 N is a home located in Davis County with nearby schools including Lakeside School, West Point Junior High School, and Syracuse High School.
Ownership History
Date
Name
Owned For
Owner Type
Purchase Details
Closed on
Jul 27, 2020
Sold by
Park Loretta S
Bought by
Park Loretta and The Loretta Park Living Trust
Current Estimated Value
Purchase Details
Closed on
Jun 13, 2016
Sold by
Hansen Sally A and Hansen Davick A
Bought by
Park Rodney D and Park Loretta
Purchase Details
Closed on
Aug 28, 2010
Sold by
Smith Russell S and Smith Lucie M
Bought by
Hansen Sally Ann and Hansen Davick A
Home Financials for this Owner
Home Financials are based on the most recent Mortgage that was taken out on this home.
Original Mortgage
$267,500
Interest Rate
4.52%
Mortgage Type
VA
Purchase Details
Closed on
Jul 10, 2002
Sold by
Craythorne Construction Inc
Bought by
Smith Russell S and Smith Lucie M
Home Financials for this Owner
Home Financials are based on the most recent Mortgage that was taken out on this home.
Original Mortgage
$170,850
Interest Rate
6.71%
Create a Home Valuation Report for This Property
The Home Valuation Report is an in-depth analysis detailing your home's value as well as a comparison with similar homes in the area
Home Values in the Area
Average Home Value in this Area
Purchase History
| Date | Buyer | Sale Price | Title Company |
|---|---|---|---|
| Park Loretta | -- | None Available | |
| Park Rodney D | -- | Mountain View Title | |
| Hansen Sally Ann | -- | Bonneville Superior Tit | |
| Smith Russell S | -- | Bonneville Title Company Inc | |
| Craythorne Construction Inc | -- | Bonneville Title Company Inc |
Source: Public Records
Mortgage History
| Date | Status | Borrower | Loan Amount |
|---|---|---|---|
| Previous Owner | Hansen Sally Ann | $267,500 | |
| Previous Owner | Smith Russell S | $170,850 |
Source: Public Records
Tax History Compared to Growth
Tax History
| Year | Tax Paid | Tax Assessment Tax Assessment Total Assessment is a certain percentage of the fair market value that is determined by local assessors to be the total taxable value of land and additions on the property. | Land | Improvement |
|---|---|---|---|---|
| 2025 | $3,089 | $297,000 | $106,884 | $190,116 |
| 2024 | $2,941 | $301,400 | $115,653 | $185,747 |
| 2023 | $2,941 | $526,000 | $134,812 | $391,188 |
| 2022 | $3,141 | $310,750 | $78,565 | $232,185 |
| 2021 | $2,971 | $436,000 | $105,006 | $330,994 |
| 2020 | $2,602 | $378,000 | $92,940 | $285,060 |
| 2019 | $2,509 | $356,000 | $101,802 | $254,198 |
| 2018 | $2,360 | $329,000 | $85,131 | $243,869 |
| 2016 | $1,781 | $153,505 | $32,396 | $121,109 |
| 2015 | $2,169 | $148,445 | $32,396 | $116,049 |
| 2014 | $1,738 | $145,698 | $32,396 | $113,302 |
| 2013 | -- | $140,493 | $31,860 | $108,633 |
Source: Public Records
Map
Nearby Homes