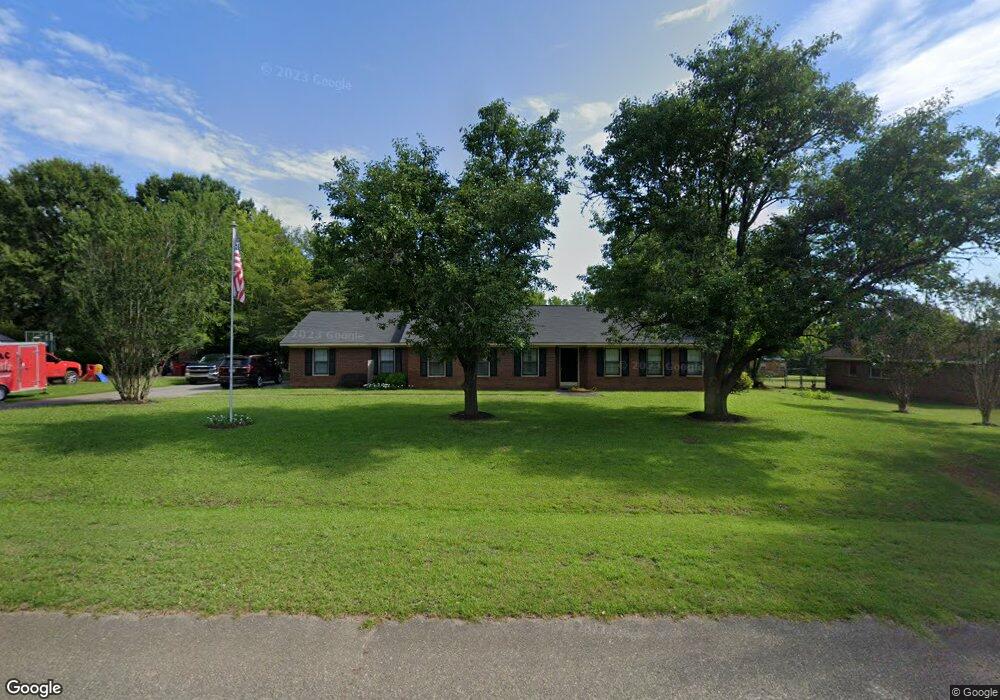
2965 Markingham Dr Macon, GA 31216
Estimated Value: $236,000 - $266,199
3
Beds
2
Baths
1,980
Sq Ft
$127/Sq Ft
Est. Value
About This Home
This home is located at 2965 Markingham Dr, Macon, GA 31216 and is currently estimated at $250,800, approximately $126 per square foot. 2965 Markingham Dr is a home located in Bibb County with nearby schools including Heard Elementary School, Rutland Middle School, and Rutland High School.
Ownership History
Date
Name
Owned For
Owner Type
Purchase Details
Closed on
Jul 22, 2021
Sold by
Williamson Timothy W and Williamson Jennifer R
Bought by
Williamson Timothy Wade and Williamson Jennifer R
Current Estimated Value
Home Financials for this Owner
Home Financials are based on the most recent Mortgage that was taken out on this home.
Original Mortgage
$100,000
Outstanding Balance
$73,749
Interest Rate
2.1%
Mortgage Type
New Conventional
Estimated Equity
$177,051
Purchase Details
Closed on
Jun 1, 2006
Sold by
Randall James T and Randall Lillie W
Bought by
Williamson Timothy W and Williamson Jennifer R
Home Financials for this Owner
Home Financials are based on the most recent Mortgage that was taken out on this home.
Original Mortgage
$125,682
Interest Rate
6.5%
Mortgage Type
FHA
Purchase Details
Closed on
Oct 30, 2002
Create a Home Valuation Report for This Property
The Home Valuation Report is an in-depth analysis detailing your home's value as well as a comparison with similar homes in the area
Purchase History
| Date | Buyer | Sale Price | Title Company |
|---|---|---|---|
| Williamson Timothy Wade | -- | None Available | |
| Williamson Timothy W | $127,000 | None Availabale | |
| -- | $115,900 | -- |
Source: Public Records
Mortgage History
| Date | Status | Borrower | Loan Amount |
|---|---|---|---|
| Open | Williamson Timothy Wade | $100,000 | |
| Closed | Williamson Timothy W | $125,682 |
Source: Public Records
Tax History
| Year | Tax Paid | Tax Assessment Tax Assessment Total Assessment is a certain percentage of the fair market value that is determined by local assessors to be the total taxable value of land and additions on the property. | Land | Improvement |
|---|---|---|---|---|
| 2025 | $1,896 | $84,145 | $18,000 | $66,145 |
| 2024 | $1,879 | $80,995 | $18,000 | $62,995 |
| 2023 | $1,422 | $80,995 | $18,000 | $62,995 |
| 2022 | $1,709 | $56,371 | $5,387 | $50,984 |
| 2021 | $1,876 | $56,371 | $5,387 | $50,984 |
| 2020 | $1,917 | $56,371 | $5,387 | $50,984 |
| 2019 | $1,933 | $56,371 | $5,387 | $50,984 |
| 2018 | $3,140 | $56,371 | $5,387 | $50,984 |
| 2017 | $1,850 | $56,371 | $5,387 | $50,984 |
| 2016 | $1,708 | $56,371 | $5,387 | $50,984 |
| 2015 | $2,418 | $56,371 | $5,387 | $50,984 |
| 2014 | $2,422 | $56,371 | $5,387 | $50,984 |
Source: Public Records
Map
Nearby Homes
- 421 Resting Fawn Place
- 6414 Ponderosa Dr
- 668 Manning Mill
- 660 Manning Mill
- 248 Sky Hawk Ln
- 3150 Holleman Dr
- 4057 Liberty Estates Dr
- 105 Sweetgum Way
- 201 Liberty Trace
- 6670 Fran Dr
- 116 Sarakay Cir
- 465 Bob White Rd
- 428 Bob White Rd
- 404 Hardwick Dr
- 261 Amanda Dr
- 405 Stonecrest Ct
- 4136 Sardis Church Rd
- 143 Jabrok Cir
- 6045 Cara Dr
- 813 Ocala National Trail
- 2981 Markingham Dr
- 2949 Markingham Dr
- 1995 Derbyshire Dr
- 2964 Markingham Dr
- 3525 Walden Rd
- 2980 Markingham Dr
- 2948 Markingham Dr
- 2917 Markingham Dr
- 3531 Walden Rd
- 3499 Walden Rd
- 2932 Markingham Dr
- 2916 Markingham Dr
- 317 Olin Ct
- 321 Olin Ct
- 3489 Walden Rd
- 313 Olin Ct
- 2901 Markingham Dr
- 3530 Walden Rd
- 325 Olin Ct
- 309 Olin Ct
Your Personal Tour Guide
Ask me questions while you tour the home.