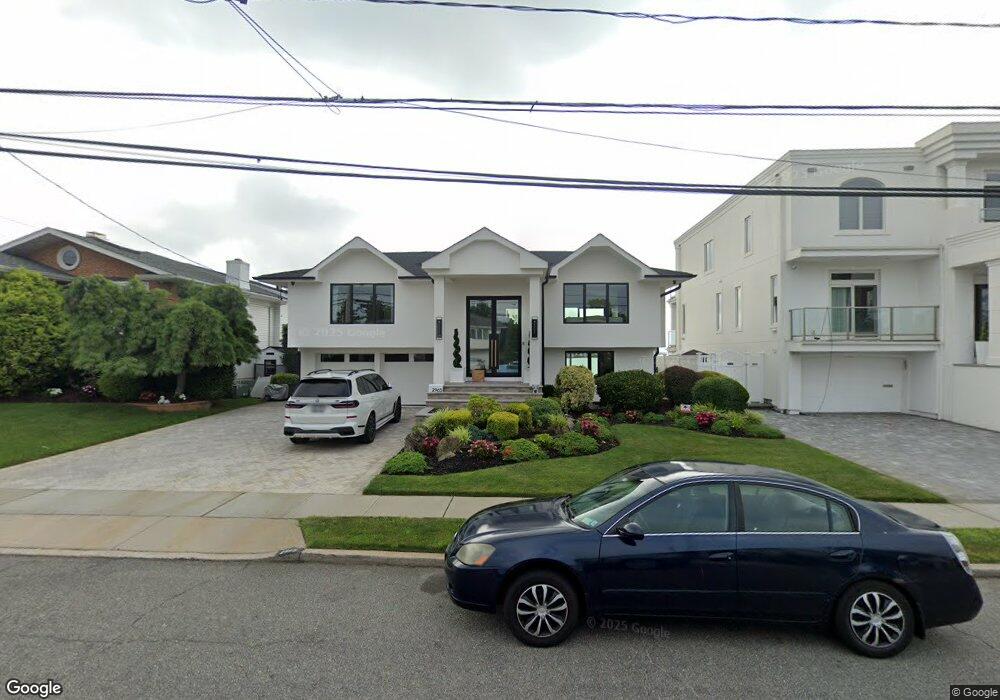
2965 Shore Dr Merrick, NY 11566
Estimated Value: $1,162,938 - $1,358,000
Studio
3
Baths
1,477
Sq Ft
$853/Sq Ft
Est. Value
About This Home
This home is located at 2965 Shore Dr, Merrick, NY 11566 and is currently estimated at $1,260,469, approximately $853 per square foot. 2965 Shore Dr is a home located in Nassau County with nearby schools including Merrick Avenue Middle School, John F. Kennedy High School, and Grace Christian Academy.
Ownership History
Date
Name
Owned For
Owner Type
Purchase Details
Closed on
Nov 25, 2020
Sold by
Hersh Dennis and Hersh Ellen
Bought by
Ametaj Ben and Ametaj Larina
Current Estimated Value
Home Financials for this Owner
Home Financials are based on the most recent Mortgage that was taken out on this home.
Original Mortgage
$765,600
Outstanding Balance
$682,828
Interest Rate
2.8%
Mortgage Type
New Conventional
Estimated Equity
$577,641
Purchase Details
Closed on
Aug 23, 2002
Sold by
Sheinker Richard
Bought by
Hersh Dennis
Purchase Details
Closed on
Dec 1, 1999
Sold by
Guttman Abraham and Guttman Joan
Bought by
Sheinker Richard and Sheinker Sharon
Home Financials for this Owner
Home Financials are based on the most recent Mortgage that was taken out on this home.
Original Mortgage
$360,000
Interest Rate
7.5%
Mortgage Type
Purchase Money Mortgage
Create a Home Valuation Report for This Property
The Home Valuation Report is an in-depth analysis detailing your home's value as well as a comparison with similar homes in the area
Home Values in the Area
Average Home Value in this Area
Purchase History
| Date | Buyer | Sale Price | Title Company |
|---|---|---|---|
| Ametaj Ben | $965,000 | Old Republic Title | |
| Hersh Dennis | $875,000 | -- | |
| Sheinker Richard | $515,000 | Commonwealth Land Title Ins |
Source: Public Records
Mortgage History
| Date | Status | Borrower | Loan Amount |
|---|---|---|---|
| Open | Ametaj Ben | $765,600 | |
| Previous Owner | Sheinker Richard | $360,000 |
Source: Public Records
Tax History
| Year | Tax Paid | Tax Assessment Tax Assessment Total Assessment is a certain percentage of the fair market value that is determined by local assessors to be the total taxable value of land and additions on the property. | Land | Improvement |
|---|---|---|---|---|
| 2025 | $24,648 | $812 | $358 | $454 |
| 2024 | $5,331 | $809 | $357 | $452 |
Source: Public Records
Map
Nearby Homes
- 1981 Cynthia Ln
- 1993 Lowell Ln
- 1841 Stanley Dr
- 1864 Cynthia Ln
- 2994 Lonni Ln
- 1827 Glenn Ln
- 2863 Harbor Rd
- 2988 Bond Dr
- 2884 Bay Dr
- 2970 Bond Dr
- 3034 Bond Dr
- 3106 Clubhouse Rd
- 2074 Ellen Dr
- 2066 Holland Way
- 2845 Whaleneck Dr
- 2729 Shore Dr
- 1903 George Ct
- 2070 Beverly Way
- 2072 Brighton Way
- 2688 Rosebud Ave
Your Personal Tour Guide
Ask me questions while you tour the home.