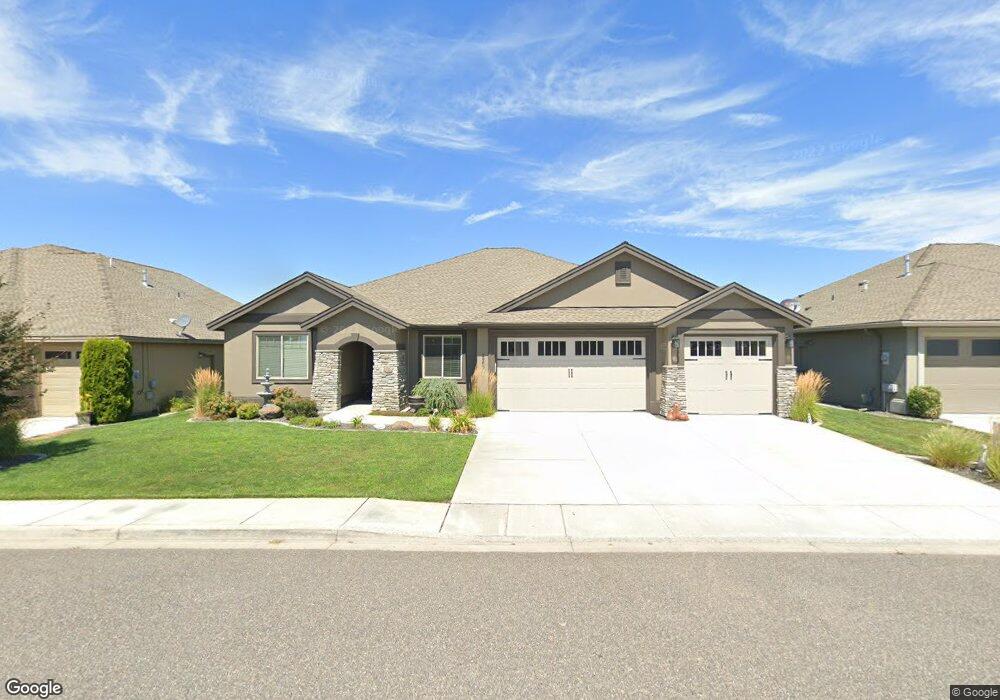
2966 Crosswater Loop Unit Overlooking the 18th Richland, WA 99354
Estimated Value: $600,646 - $673,000
4
Beds
3
Baths
2,355
Sq Ft
$272/Sq Ft
Est. Value
About This Home
This home is located at 2966 Crosswater Loop Unit Overlooking the 18th, Richland, WA 99354 and is currently estimated at $641,662, approximately $272 per square foot. 2966 Crosswater Loop Unit Overlooking the 18th is a home located in Benton County with nearby schools including Sacajawea Elementary School, Chief Joseph Middle School, and Hanford High School.
Ownership History
Date
Name
Owned For
Owner Type
Purchase Details
Closed on
Jan 13, 2022
Sold by
Baird Richard E and Baird Laurie L
Bought by
Macrae Charles and Macrae Linda
Current Estimated Value
Purchase Details
Closed on
Jul 3, 2014
Sold by
Pahlisch Homes Inc
Bought by
Baird Richard E and Baird Laurie L
Home Financials for this Owner
Home Financials are based on the most recent Mortgage that was taken out on this home.
Original Mortgage
$356,250
Interest Rate
4.09%
Mortgage Type
New Conventional
Purchase Details
Closed on
Oct 23, 2013
Sold by
North Stone Richland Llc
Bought by
Pahlisch Homes Inc
Home Financials for this Owner
Home Financials are based on the most recent Mortgage that was taken out on this home.
Original Mortgage
$286,400
Interest Rate
4.46%
Mortgage Type
Construction
Create a Home Valuation Report for This Property
The Home Valuation Report is an in-depth analysis detailing your home's value as well as a comparison with similar homes in the area
Home Values in the Area
Average Home Value in this Area
Purchase History
| Date | Buyer | Sale Price | Title Company |
|---|---|---|---|
| Macrae Charles | $680,588 | Cascade Title | |
| Baird Richard E | $375,000 | Stewart Title Company | |
| Pahlisch Homes Inc | $75,000 | Cascade Title |
Source: Public Records
Mortgage History
| Date | Status | Borrower | Loan Amount |
|---|---|---|---|
| Previous Owner | Baird Richard E | $356,250 | |
| Previous Owner | Pahlisch Homes Inc | $286,400 |
Source: Public Records
Tax History Compared to Growth
Tax History
| Year | Tax Paid | Tax Assessment Tax Assessment Total Assessment is a certain percentage of the fair market value that is determined by local assessors to be the total taxable value of land and additions on the property. | Land | Improvement |
|---|---|---|---|---|
| 2024 | $5,269 | $556,700 | $85,000 | $471,700 |
| 2023 | $5,269 | $564,180 | $85,000 | $479,180 |
| 2022 | $4,571 | $459,360 | $85,000 | $374,360 |
| 2021 | $4,415 | $414,440 | $85,000 | $329,440 |
| 2020 | $4,670 | $384,490 | $85,000 | $299,490 |
| 2019 | $4,671 | $384,490 | $85,000 | $299,490 |
| 2018 | $4,832 | $414,720 | $79,400 | $335,320 |
| 2017 | $4,271 | $358,830 | $79,400 | $279,430 |
| 2016 | $4,209 | $358,830 | $79,400 | $279,430 |
| 2015 | $3,618 | $358,830 | $79,400 | $279,430 |
| 2014 | -- | $302,590 | $79,400 | $223,190 |
| 2013 | -- | $79,400 | $79,400 | $0 |
Source: Public Records
Map
Nearby Homes
- 2935 Crosswater Loop
- 2900 Crosswater Loop
- 2829 Copperstone St
- 2818 Tuscanna Dr
- 2793 Sawgrass Loop
- 2876 Crosswater Loop
- 2895 Sawgrass Loop
- 2312 Coppercreek St
- 2730 Sawgrass Loop
- 2539 Prestwick Dr
- 2940 Sedona Cir
- 2965 Sonoran Dr
- 2665 Maidstone St
- 2691 Eagle Watch Loop
- 2723 Stonecreek Dr
- 3020 Redrock Ridge Loop
- 3359 Village Pkwy
- 3216 Wild Canyon Way
- The Siskiyou Plan at Quail Ridge at Horn Rapids
- The Shasta Plan at Quail Ridge at Horn Rapids
- 2966 Crosswater Loop
- 2972 Crosswater Loop
- 2972 Crosswater Loop Unit $6K INCENTIVE! Overl
- 2972 Crosswater Loop Unit View 18th Tee & Fair
- 2960 Crosswater Loop
- 2960 Crosswater Loop Unit OVERLOOKING 18TH GRE
- 2954 Crosswater Loop
- 2971 Crosswater Loop
- 2978 Crosswater Loop
- 2965 Crosswater Loop
- 2948 Crosswater Loop
- 2984 Crosswater Loop
- 2990 Crosswater Loop
- 2942 Crosswater Loop
- 2814 Riverbend Dr Unit View of the Signatur
- 2814 Riverbend Dr Unit Panoramic View
- 2814 Riverbend Dr
- 2947 Crosswater Loop
- 2398 Copperhill St
- 2808 Riverbend Dr