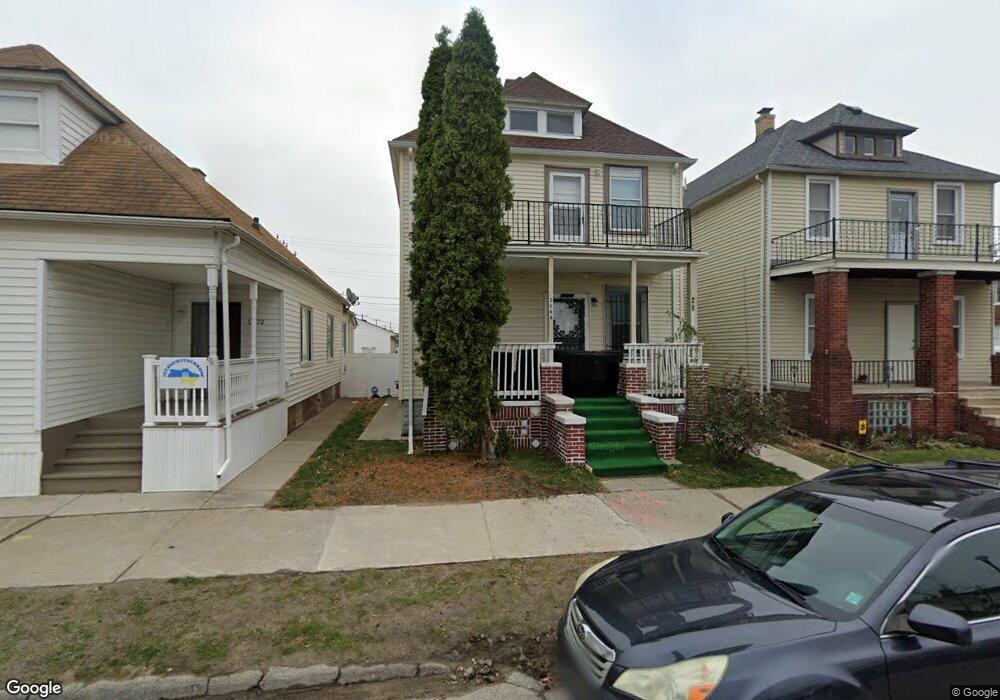
2966 Evaline St HamtraMcK, MI 48212
Estimated Value: $224,338 - $277,000
4
Beds
--
Bath
1,800
Sq Ft
$140/Sq Ft
Est. Value
About This Home
This home is located at 2966 Evaline St, HamtraMcK, MI 48212 and is currently estimated at $252,335, approximately $140 per square foot. 2966 Evaline St is a home located in Wayne County with nearby schools including Dickinson East Elementary School, Kosciuszko Middle School, and Hamtramck High School.
Ownership History
Date
Name
Owned For
Owner Type
Purchase Details
Closed on
Nov 16, 2012
Sold by
Wayne County Treasurer
Bought by
Alhalmy Nagib K
Current Estimated Value
Purchase Details
Closed on
Apr 5, 2006
Sold by
Mtglq Investors Lp
Bought by
Al Tihami Yousef A
Home Financials for this Owner
Home Financials are based on the most recent Mortgage that was taken out on this home.
Original Mortgage
$57,600
Interest Rate
10.4%
Mortgage Type
Purchase Money Mortgage
Purchase Details
Closed on
Jun 2, 2005
Sold by
Camaj Ljulja and Carnaj Maras
Bought by
Mtglq Investors Lp
Purchase Details
Closed on
Mar 12, 2004
Sold by
Camaj Maras and Camaj Lula
Bought by
Camaj Maras
Home Financials for this Owner
Home Financials are based on the most recent Mortgage that was taken out on this home.
Original Mortgage
$90,300
Interest Rate
8.9%
Mortgage Type
New Conventional
Purchase Details
Closed on
Jun 20, 1997
Sold by
Krystyna Aleksander and Krystyna Pe
Bought by
Maras Lula and Maras Camaj
Create a Home Valuation Report for This Property
The Home Valuation Report is an in-depth analysis detailing your home's value as well as a comparison with similar homes in the area
Home Values in the Area
Average Home Value in this Area
Purchase History
| Date | Buyer | Sale Price | Title Company |
|---|---|---|---|
| Alhalmy Nagib K | $15,100 | None Available | |
| Al Tihami Yousef A | $72,000 | None Available | |
| Mtglq Investors Lp | $96,741 | -- | |
| Camaj Maras | -- | Greco | |
| Maras Lula | $56,000 | -- |
Source: Public Records
Mortgage History
| Date | Status | Borrower | Loan Amount |
|---|---|---|---|
| Previous Owner | Al Tihami Yousef A | $57,600 | |
| Previous Owner | Camaj Maras | $90,300 |
Source: Public Records
Tax History
| Year | Tax Paid | Tax Assessment Tax Assessment Total Assessment is a certain percentage of the fair market value that is determined by local assessors to be the total taxable value of land and additions on the property. | Land | Improvement |
|---|---|---|---|---|
| 2025 | $1,163 | $101,400 | $0 | $0 |
| 2024 | $1,152 | $88,000 | $0 | $0 |
| 2023 | $1,333 | $72,400 | $0 | $0 |
| 2022 | $1,141 | $62,200 | $0 | $0 |
| 2021 | $1,292 | $50,200 | $0 | $0 |
| 2020 | $1,283 | $42,700 | $0 | $0 |
| 2019 | $1,272 | $34,400 | $0 | $0 |
| 2018 | $975 | $29,500 | $0 | $0 |
| 2017 | $527 | $24,300 | $0 | $0 |
| 2016 | $1,205 | $21,900 | $0 | $0 |
| 2015 | $2,080 | $20,800 | $0 | $0 |
| 2013 | $2,110 | $21,100 | $0 | $0 |
| 2012 | $1,343 | $23,500 | $2,400 | $21,100 |
Source: Public Records
Map
Nearby Homes
- 3031 Trowbridge St
- 3321 Doremus St
- 3360 Norwalk St
- 3193 Trowbridge St
- 3321 Holbrook St
- 2255 Yemans St
- 2361 Caniff St
- 3017 Jacob St
- 3057 Jacob St
- 3828 Doremus St
- 2227 Florian St
- 2214 Florian St
- 3170 Jacob St
- 2436 Hewitt St
- 11655 Mitchell St
- 11667 Mitchell St
- 8820 Joseph Campau St Unit 3
- 11705 Mackay St
- 2946 Goodson St
- 3837 Harold St
- 2972 Evaline St
- 2960 Evaline St
- 9536 Mitchell St
- 2984 Evaline St
- 9530 Mitchell St
- 2990 Evaline St
- 9537 Mcdougall St Unit Bldg-Unit
- 9537 Mcdougall St
- 9526 Mitchell St
- 2936 Evaline St
- 9533 Mcdougall St
- 2949 Evaline St
- 2975 Evaline St
- 2981 Evaline St
- 9518 Mitchell St
- 9527 Mcdougall St
- 9537 Mitchell St
- 2985 Evaline St
- 9533 Mitchell St
- 2991 Evaline St
Your Personal Tour Guide
Ask me questions while you tour the home.