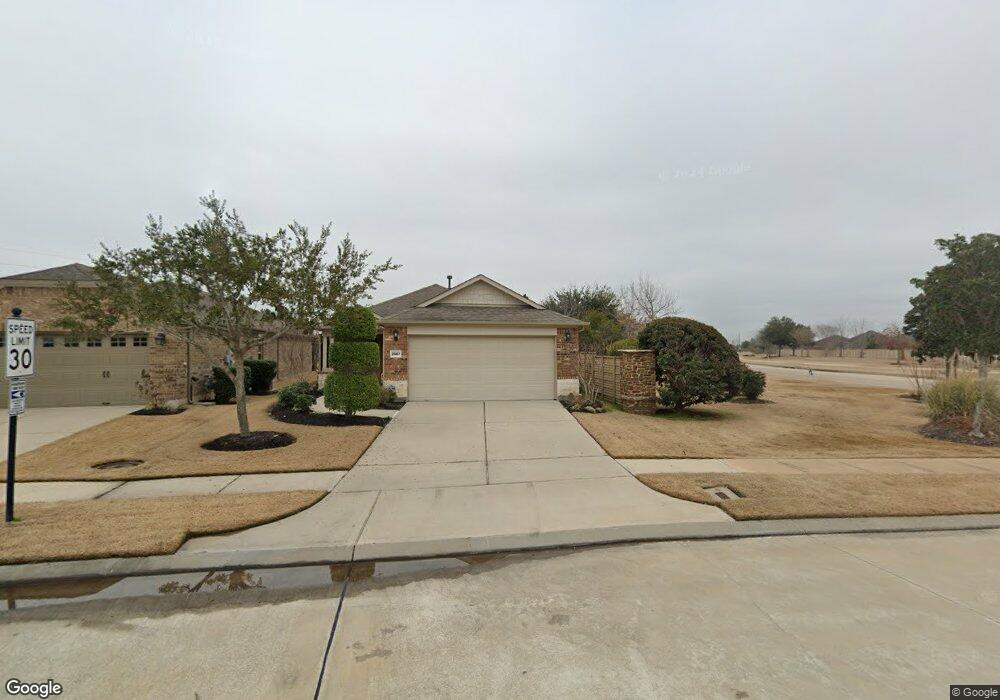
2967 Cone Flower Dr Richmond, TX 77469
Estimated Value: $289,690 - $311,000
2
Beds
2
Baths
1,549
Sq Ft
$196/Sq Ft
Est. Value
About This Home
This home is located at 2967 Cone Flower Dr, Richmond, TX 77469 and is currently estimated at $303,173, approximately $195 per square foot. 2967 Cone Flower Dr is a home with nearby schools including J J Wessendorff Middle School, Lamar Junior High School, and Lamar Consolidated High School.
Ownership History
Date
Name
Owned For
Owner Type
Purchase Details
Closed on
Apr 1, 2021
Sold by
Stemmer Joyce M and Estate Of Michael Stemmer
Bought by
Stemmer Joyce M
Current Estimated Value
Home Financials for this Owner
Home Financials are based on the most recent Mortgage that was taken out on this home.
Original Mortgage
$161,810
Outstanding Balance
$145,859
Interest Rate
2.9%
Mortgage Type
New Conventional
Estimated Equity
$157,314
Purchase Details
Closed on
Mar 26, 2014
Sold by
Pulte Homes Of Texas Lp
Bought by
Stemmer Michael T and Stemmer Joyce M
Home Financials for this Owner
Home Financials are based on the most recent Mortgage that was taken out on this home.
Original Mortgage
$180,295
Interest Rate
4.32%
Mortgage Type
New Conventional
Purchase Details
Closed on
Apr 13, 2012
Sold by
Cw Richmond Lp
Bought by
Stemmer Michael T and Stemmer Joyce M
Create a Home Valuation Report for This Property
The Home Valuation Report is an in-depth analysis detailing your home's value as well as a comparison with similar homes in the area
Home Values in the Area
Average Home Value in this Area
Purchase History
| Date | Buyer | Sale Price | Title Company |
|---|---|---|---|
| Stemmer Joyce M | -- | Timos Inc | |
| Stemmer Michael T | -- | None Available | |
| Stemmer Michael T | -- | -- |
Source: Public Records
Mortgage History
| Date | Status | Borrower | Loan Amount |
|---|---|---|---|
| Open | Stemmer Joyce M | $161,810 | |
| Closed | Stemmer Michael T | $180,295 |
Source: Public Records
Tax History Compared to Growth
Tax History
| Year | Tax Paid | Tax Assessment Tax Assessment Total Assessment is a certain percentage of the fair market value that is determined by local assessors to be the total taxable value of land and additions on the property. | Land | Improvement |
|---|---|---|---|---|
| 2025 | $3,629 | $300,063 | $39,000 | $261,063 |
| 2024 | $3,629 | $280,962 | $20,719 | $260,243 |
| 2023 | $3,705 | $255,420 | $0 | $260,228 |
| 2022 | $5,074 | $232,200 | $2,960 | $229,240 |
| 2021 | $6,237 | $211,090 | $30,000 | $181,090 |
| 2020 | $6,290 | $207,080 | $30,000 | $177,080 |
| 2019 | $6,502 | $201,060 | $30,000 | $171,060 |
| 2018 | $6,507 | $199,040 | $30,000 | $169,040 |
| 2017 | $6,625 | $201,110 | $30,000 | $171,110 |
| 2016 | $7,011 | $212,830 | $30,000 | $182,830 |
| 2015 | $2,679 | $205,290 | $30,000 | $175,290 |
| 2014 | $784 | $41,590 | $25,500 | $16,090 |
Source: Public Records
Map
Nearby Homes
- 2951 Coral Berry Ct
- 23814 Pullin Market Dr
- 2926 Coral Berry Ct
- 2811 Cone Flower Dr
- 23743 Travers Hill Rd
- 1311 Hudgins Pass
- 7034 Glennwick Grove Ln
- 23719 Sweeny Valley Dr
- 23714 Sweeny Valley Dr
- 1622 Boone Hollow Ln
- 809 Cardinal Flower Dr
- 1415 Stuart Run Dr
- 2918 Persimmon Grove
- 24007 Barnett Overlook
- 2236 Par Ln
- 3503 Anchor Cove
- 1022 Majestic Oak
- 24323 Rose Cobbler Dr
- 24331 Dyer Hill Way
- 342 Ranch House Ln
- 2963 Cone Flower Dr
- 2959 Cone Flower Dr
- 2955 Cone Flower Dr
- 2954 Cone Flower Dr
- 2950 Cone Flower Dr
- 2951 Cone Flower Dr
- 2946 Cone Flower Dr
- 2947 Cone Flower Dr
- 3007 Grey Hawk Cove
- 2942 Cone Flower Dr
- 2943 Cone Flower Dr
- 2947 Coral Berry Ct
- 2938 Cone Flower Dr
- 23719 Mock Wagon Way
- 23711 Mock Wagon Way
- 23703 Mock Wagon Way
- 23707 Mock Wagon Way
- 3011 Grey Hawk Cove
- 2939 Cone Flower Dr
- 23715 Mock Wagon Way