2968 Londonbury St NW Uniontown, OH 44685
Estimated Value: $385,000 - $501,000
4
Beds
3
Baths
2,194
Sq Ft
$202/Sq Ft
Est. Value
About This Home
This home is located at 2968 Londonbury St NW, Uniontown, OH 44685 and is currently estimated at $442,272, approximately $201 per square foot. 2968 Londonbury St NW is a home located in Stark County with nearby schools including Lake Middle/High School and Lake Center Christian School.
Ownership History
Date
Name
Owned For
Owner Type
Purchase Details
Closed on
Jun 13, 2011
Sold by
Vesely Nicholas W and Vesely Julie L
Bought by
Kracker Zachary and Kracker Jessica D
Current Estimated Value
Home Financials for this Owner
Home Financials are based on the most recent Mortgage that was taken out on this home.
Original Mortgage
$206,625
Interest Rate
4.8%
Mortgage Type
New Conventional
Purchase Details
Closed on
Jul 28, 2009
Sold by
Jrk Holdings Ltd
Bought by
Vesely Nicholas W and Vesely Julie L
Home Financials for this Owner
Home Financials are based on the most recent Mortgage that was taken out on this home.
Original Mortgage
$172,358
Interest Rate
5.25%
Mortgage Type
Future Advance Clause Open End Mortgage
Purchase Details
Closed on
Mar 31, 2009
Sold by
Jrk Holdings Ltd
Bought by
Jrk Holdings Ltd
Purchase Details
Closed on
Mar 26, 2009
Sold by
The Home Savings & Loan Company Of Young
Bought by
Jrk Holdings Ltd
Purchase Details
Closed on
Mar 5, 2009
Sold by
W S Homes Inc
Bought by
The Home Savings & Loan Company Of Young
Create a Home Valuation Report for This Property
The Home Valuation Report is an in-depth analysis detailing your home's value as well as a comparison with similar homes in the area
Home Values in the Area
Average Home Value in this Area
Purchase History
| Date | Buyer | Sale Price | Title Company |
|---|---|---|---|
| Kracker Zachary | $217,500 | Attorney | |
| Vesely Nicholas W | $38,000 | Attorney | |
| Jrk Holdings Ltd | -- | Quest Title Agency Inc | |
| Jrk Holdings Ltd | $161,200 | Quest Title Agency Inc | |
| The Home Savings & Loan Company Of Young | $170,000 | None Available |
Source: Public Records
Mortgage History
| Date | Status | Borrower | Loan Amount |
|---|---|---|---|
| Closed | Kracker Zachary | $206,625 | |
| Closed | Vesely Nicholas W | $172,358 |
Source: Public Records
Tax History Compared to Growth
Tax History
| Year | Tax Paid | Tax Assessment Tax Assessment Total Assessment is a certain percentage of the fair market value that is determined by local assessors to be the total taxable value of land and additions on the property. | Land | Improvement |
|---|---|---|---|---|
| 2025 | $7,775 | $140,180 | $38,400 | $101,780 |
| 2024 | $6,546 | $140,180 | $38,400 | $101,780 |
| 2023 | $6,546 | $110,710 | $31,430 | $79,280 |
| 2022 | $5,687 | $110,710 | $31,430 | $79,280 |
| 2021 | $5,747 | $110,710 | $31,430 | $79,280 |
| 2020 | $5,540 | $95,340 | $27,090 | $68,250 |
| 2019 | $5,496 | $95,340 | $27,090 | $68,250 |
| 2018 | $5,501 | $95,340 | $27,090 | $68,250 |
| 2017 | $5,548 | $88,970 | $27,020 | $61,950 |
| 2016 | $5,558 | $88,970 | $27,020 | $61,950 |
| 2015 | $5,558 | $88,970 | $27,020 | $61,950 |
| 2014 | $592 | $75,500 | $22,930 | $52,570 |
| 2013 | $2,320 | $75,500 | $22,930 | $52,570 |
Source: Public Records
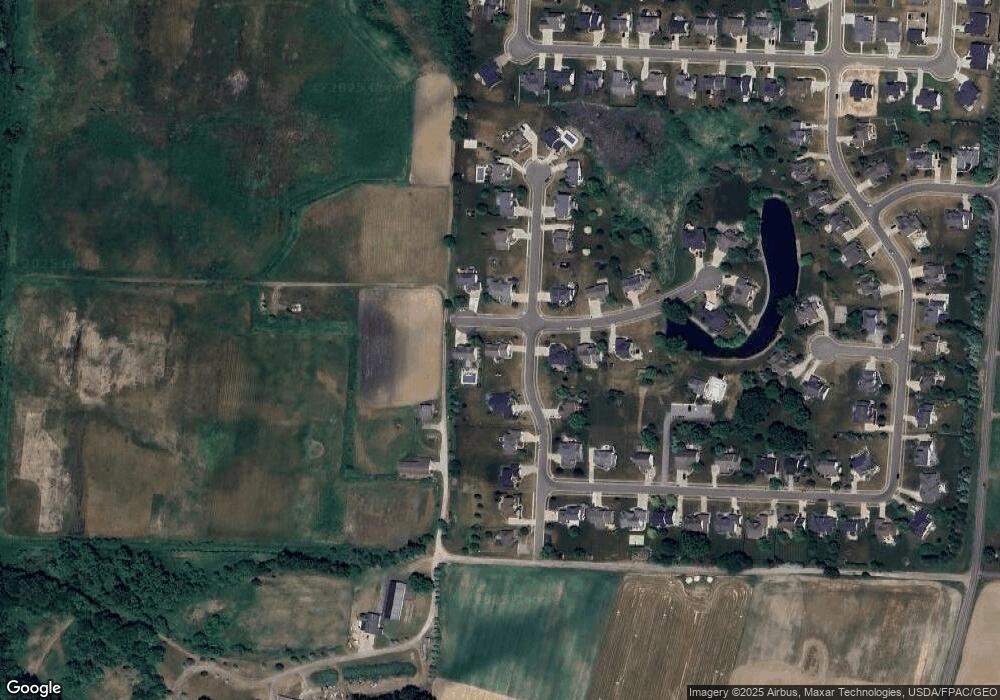
Map
Nearby Homes
- 12235 Cantburg Ave NW
- 843 Brodie Ct
- 835 Brodie Ct
- 12494 Bridgemont Ave NW
- 2693 Ledgestone Dr NW
- 2335 Ledgestone Dr NW
- 2273 Ledgestone Dr NW
- 2319 Ledgestone Dr NW
- 2255 Ledgestone Dr NW
- 2334 Ledgestone Dr NW
- 2244 Ledgestone Dr NW
- 2316 Ledgestone Dr NW
- 2490 Ledgestone Dr NW
- 12855 Redwood Ave NW
- 0 Pine St NW
- 2601 Lake Center St NW
- 13025 Sunset Cir NW
- 3771 Edison St NW
- 3648 Mulberry St NW
- 12374 Springwater Ave NW
- 12317 Cantburg Ave NW
- 2990 Londonbury St NW
- 12316 (S/L 75) Cantburg Ave NW
- 12291 S/L 52 Cantburg Ave NW
- 12291 Cantburg Ave NW
- 12316 Cantburg Ave NW
- 12317 (S/L 53) Cantburg Ave NW
- 12317 Londonburg Ave NW
- 12317 (S/L 54) Londonburg Ave NW
- 2969 Londonbury St NW
- 12273 Cantburg Ave NW
- 12273-(SL 51) Cantburg
- 2991 Londonbury St NW
- 2922 Londonbury St NW
- 2922 (S/L 74) Londonbury St NW
- 2941 Londonbury St NW
- 12290 Cantburg Ave NW
- 2933 Carriage Stone St NW
- 12430 (S/L 61) Cantburg Ave NW
- 2917 (S/L 66) Londonbury St NW