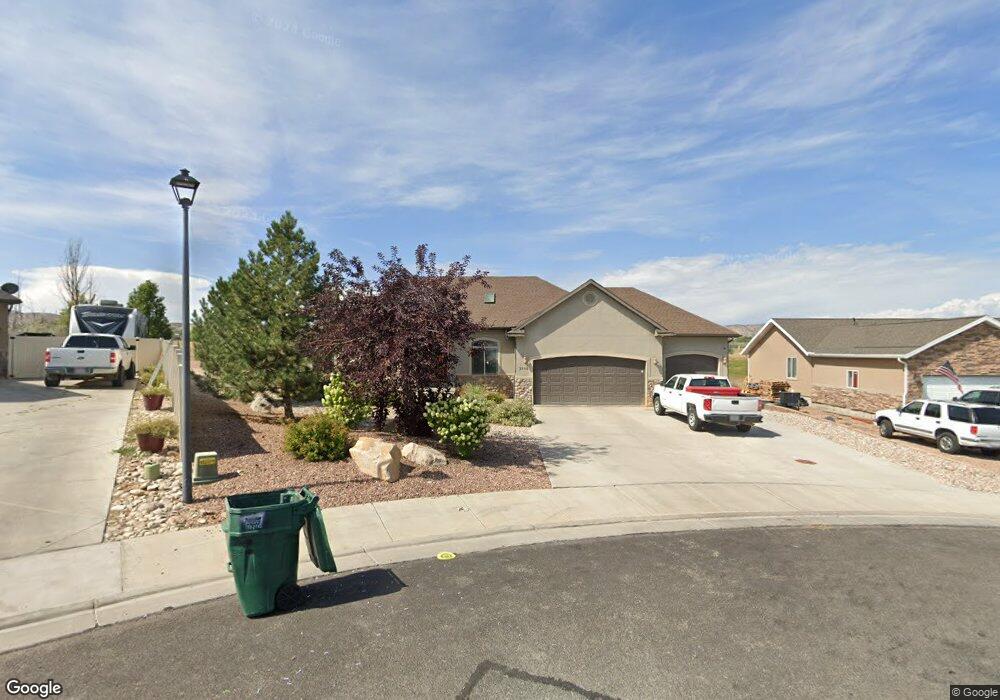
2968 S 290 E Vernal, UT 84078
Estimated Value: $516,994 - $654,000
3
Beds
3
Baths
4,090
Sq Ft
$141/Sq Ft
Est. Value
About This Home
This home is located at 2968 S 290 E, Vernal, UT 84078 and is currently estimated at $577,499, approximately $141 per square foot. 2968 S 290 E is a home located in Uintah County with nearby schools including Davis School, Vernal Middle School, and Uintah Middle School.
Ownership History
Date
Name
Owned For
Owner Type
Purchase Details
Closed on
Mar 17, 2022
Sold by
Sarver Zachary and Crawford Laurie
Bought by
Sarver Zachary
Current Estimated Value
Home Financials for this Owner
Home Financials are based on the most recent Mortgage that was taken out on this home.
Original Mortgage
$339,500
Outstanding Balance
$318,048
Interest Rate
4.16%
Mortgage Type
New Conventional
Estimated Equity
$259,451
Purchase Details
Closed on
Oct 19, 2007
Sold by
Thresher Luann
Bought by
Massand Ghanshyam P and Massand Colleen S
Home Financials for this Owner
Home Financials are based on the most recent Mortgage that was taken out on this home.
Original Mortgage
$300,000
Interest Rate
6.42%
Mortgage Type
New Conventional
Purchase Details
Closed on
Feb 2, 2007
Sold by
Thresher Luann and Brown Ivan Wade
Bought by
Thresher Luann
Create a Home Valuation Report for This Property
The Home Valuation Report is an in-depth analysis detailing your home's value as well as a comparison with similar homes in the area
Purchase History
| Date | Buyer | Sale Price | Title Company |
|---|---|---|---|
| Sarver Zachary | -- | Basin Land Title | |
| Sarver Zachary | -- | Basin Land Title | |
| Massand Ghanshyam P | -- | -- | |
| Thresher Luann | -- | -- |
Source: Public Records
Mortgage History
| Date | Status | Borrower | Loan Amount |
|---|---|---|---|
| Open | Sarver Zachary | $339,500 | |
| Closed | Sarver Zachary | $339,500 | |
| Previous Owner | Massand Ghanshyam P | $300,000 |
Source: Public Records
Tax History
| Year | Tax Paid | Tax Assessment Tax Assessment Total Assessment is a certain percentage of the fair market value that is determined by local assessors to be the total taxable value of land and additions on the property. | Land | Improvement |
|---|---|---|---|---|
| 2024 | $2,556 | $288,074 | $17,549 | $270,525 |
| 2023 | $2,494 | $254,852 | $17,549 | $237,303 |
| 2022 | $2,207 | $207,391 | $17,549 | $189,842 |
| 2021 | $2,267 | $96,663 | $9,652 | $87,011 |
| 2020 | $2,089 | $166,196 | $16,500 | $149,696 |
| 2019 | $2,114 | $166,196 | $16,500 | $149,696 |
| 2018 | $2,020 | $159,067 | $16,500 | $142,567 |
| 2017 | $20 | $159,067 | $16,500 | $142,567 |
| 2016 | $1,896 | $163,477 | $16,500 | $146,977 |
| 2015 | $1,870 | $174,694 | $16,500 | $158,194 |
| 2014 | $1,757 | $165,740 | $16,500 | $149,240 |
| 2013 | $1,793 | $165,740 | $16,500 | $149,240 |
Source: Public Records
Map
Nearby Homes
- 2952 S 290 E Unit 17
- 2952 S 290 E
- 292 E 2970 S
- 306 E 2970 S
- 306 E 2970 S Unit 20
- 2934 S 290 E Unit 16
- 2934 S 290 E
- 305 E 2970 S Unit 39
- 319 E 2970 S Unit 38
- 2916 S 290 E Unit 15
- 2916 S 290 E
- 324 E 2970 S Unit Lot 21
- 324 E 2970 S
- 304 E 2900 S Unit 40
- 304 E 2900 S
- 335 E 2970 S Unit 37
- 318 E 2900 S
- 318 E 2900 S Unit 41
- 342 E 2970 S
- 342 E 2970 S Unit 21
Your Personal Tour Guide
Ask me questions while you tour the home.