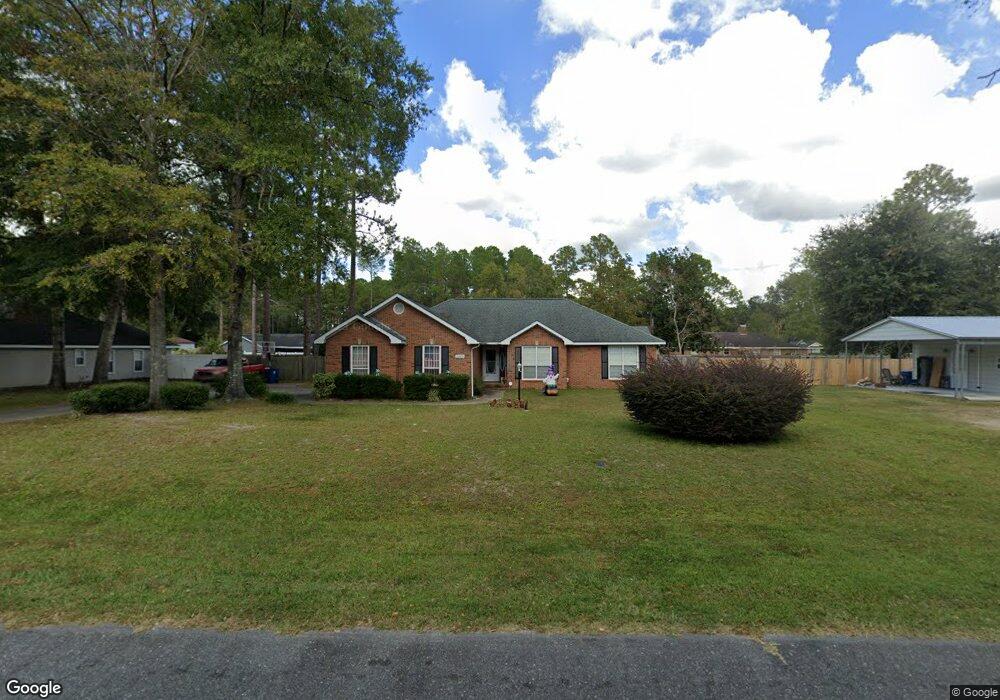
2969 Pineland Dr Waycross, GA 31503
Estimated Value: $252,525 - $285,000
3
Beds
2
Baths
1,666
Sq Ft
$162/Sq Ft
Est. Value
About This Home
This home is located at 2969 Pineland Dr, Waycross, GA 31503 and is currently estimated at $269,131, approximately $161 per square foot. 2969 Pineland Dr is a home located in Ware County with nearby schools including Williams Heights Elementary School, Waycross Middle School, and Ware County High School.
Ownership History
Date
Name
Owned For
Owner Type
Purchase Details
Closed on
Jun 14, 2019
Sold by
Storrs Matthew Allen
Bought by
Epps William Douglas
Current Estimated Value
Home Financials for this Owner
Home Financials are based on the most recent Mortgage that was taken out on this home.
Original Mortgage
$143,846
Outstanding Balance
$127,229
Interest Rate
4.4%
Mortgage Type
FHA
Estimated Equity
$141,902
Purchase Details
Closed on
Dec 6, 2013
Sold by
Hubacher Philip Scott
Bought by
Storrs Matthew Allen and Ashlaw Storrs Stacy Rae
Home Financials for this Owner
Home Financials are based on the most recent Mortgage that was taken out on this home.
Original Mortgage
$127,687
Interest Rate
4.19%
Mortgage Type
VA
Purchase Details
Closed on
Jan 21, 1994
Bought by
Hubacher Philip Scott and Hubacher Robyn
Purchase Details
Closed on
Jan 18, 1994
Bought by
Johnson Lamar
Create a Home Valuation Report for This Property
The Home Valuation Report is an in-depth analysis detailing your home's value as well as a comparison with similar homes in the area
Home Values in the Area
Average Home Value in this Area
Purchase History
| Date | Buyer | Sale Price | Title Company |
|---|---|---|---|
| Epps William Douglas | $146,500 | -- | |
| Storrs Matthew Allen | $125,000 | -- | |
| Hubacher Philip Scott | $8,500 | -- | |
| Johnson Lamar | $8,500 | -- |
Source: Public Records
Mortgage History
| Date | Status | Borrower | Loan Amount |
|---|---|---|---|
| Open | Epps William Douglas | $143,846 | |
| Previous Owner | Storrs Matthew Allen | $127,687 |
Source: Public Records
Tax History Compared to Growth
Tax History
| Year | Tax Paid | Tax Assessment Tax Assessment Total Assessment is a certain percentage of the fair market value that is determined by local assessors to be the total taxable value of land and additions on the property. | Land | Improvement |
|---|---|---|---|---|
| 2024 | $1,263 | $83,194 | $8,892 | $74,302 |
| 2023 | $1,312 | $72,328 | $12,000 | $60,328 |
| 2022 | $1,434 | $72,328 | $12,000 | $60,328 |
| 2021 | $1,508 | $59,910 | $12,000 | $47,910 |
| 2020 | $1,524 | $58,364 | $12,000 | $46,364 |
| 2019 | $1,619 | $50,065 | $12,000 | $38,065 |
| 2018 | $1,575 | $48,252 | $12,000 | $36,252 |
| 2017 | $1,508 | $48,252 | $12,000 | $36,252 |
| 2016 | $1,508 | $48,252 | $12,000 | $36,252 |
| 2015 | $1,522 | $48,252 | $12,000 | $36,252 |
| 2014 | $1,520 | $48,252 | $12,000 | $36,252 |
| 2013 | -- | $48,252 | $12,000 | $36,252 |
Source: Public Records
Map
Nearby Homes
- 763 Kentland Dr
- 867 Kentland Dr
- 3070 Central Ave
- 723 St Bernard Trail
- 2775 Seminole Trail
- 3153 Southwood Dr
- 1049 Riverdale Dr
- 955 Lynn Dr
- 1132 Hilltop Rd
- 914 Barkley St
- 0 Brunswick Hwy Unit 1648370
- 291 Sawdust Trail
- 3817 Central Ave
- 1312 Atlantic Ave
- 807 City Blvd
- 1502 Seminole Trail
- 1204 Richmond Ave
- 1617 Moss Creek Rd
- 1622 Booth St
- 4155 Pinecrest Rd
- 2939 Pineland Dr
- 0 Pineland Dr
- 2964 Wood Duck Dr
- 2970 Wood Duck Dr
- 2942 Wood Duck Dr
- 2972 Pineland Dr
- 2915 Pineland Dr
- 2938 Pineland Dr
- 3015 Pineland Dr
- 2990 Pineland Dr
- 3002 Wood Duck Dr
- 2920 Pineland Dr
- 3020 Pineland Dr
- 3039 Pineland Dr
- 2969 Birchwood Dr
- 2939 Birchwood Dr
- 2985 Birchwood Dr
- 3020 Wood Duck Dr
- 0000 Kentland Dr
- 3038 Pineland Dr