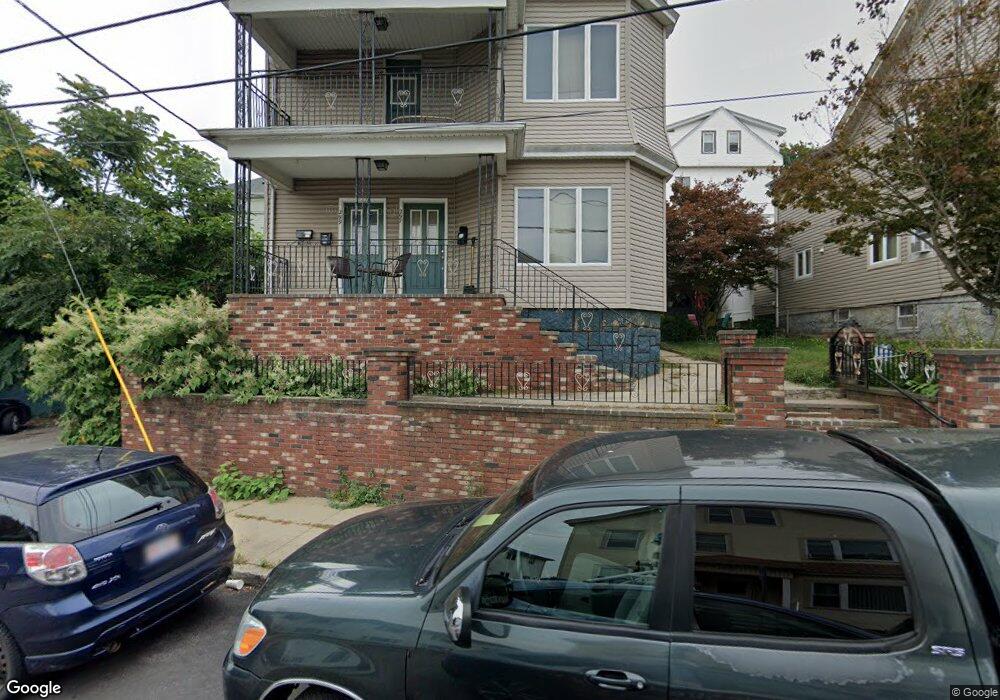
297 Barnaby St Fall River, MA 02720
Lower Highlands NeighborhoodEstimated Value: $546,000 - $682,000
5
Beds
3
Baths
3,648
Sq Ft
$174/Sq Ft
Est. Value
About This Home
This home is located at 297 Barnaby St, Fall River, MA 02720 and is currently estimated at $633,102, approximately $173 per square foot. 297 Barnaby St is a home located in Bristol County with nearby schools including Mary Fonseca Elementary School, Morton Middle School, and B M C Durfee High School.
Ownership History
Date
Name
Owned For
Owner Type
Purchase Details
Closed on
Jun 3, 2004
Sold by
Lopes Daniel F and Lopes Fernanda
Bought by
Carvalho Brian and Carvalho Nancy
Current Estimated Value
Home Financials for this Owner
Home Financials are based on the most recent Mortgage that was taken out on this home.
Original Mortgage
$319,978
Interest Rate
5.94%
Mortgage Type
Purchase Money Mortgage
Purchase Details
Closed on
Feb 4, 1992
Sold by
Cordeiro Gilbert B and Cordeiro Josephine
Bought by
Lopes Daniel F and Lopes Fernanda
Home Financials for this Owner
Home Financials are based on the most recent Mortgage that was taken out on this home.
Original Mortgage
$72,100
Interest Rate
8.44%
Mortgage Type
Purchase Money Mortgage
Create a Home Valuation Report for This Property
The Home Valuation Report is an in-depth analysis detailing your home's value as well as a comparison with similar homes in the area
Home Values in the Area
Average Home Value in this Area
Purchase History
| Date | Buyer | Sale Price | Title Company |
|---|---|---|---|
| Carvalho Brian | $325,000 | -- | |
| Lopes Daniel F | $103,000 | -- |
Source: Public Records
Mortgage History
| Date | Status | Borrower | Loan Amount |
|---|---|---|---|
| Open | Lopes Daniel F | $310,387 | |
| Closed | Lopes Daniel F | $319,978 | |
| Previous Owner | Lopes Daniel F | $72,100 | |
| Closed | Lopes Daniel F | $10,300 |
Source: Public Records
Tax History
| Year | Tax Paid | Tax Assessment Tax Assessment Total Assessment is a certain percentage of the fair market value that is determined by local assessors to be the total taxable value of land and additions on the property. | Land | Improvement |
|---|---|---|---|---|
| 2025 | $6,442 | $562,600 | $107,000 | $455,600 |
| 2024 | $6,157 | $535,900 | $103,100 | $432,800 |
| 2023 | $5,427 | $442,300 | $85,100 | $357,200 |
| 2022 | $4,802 | $380,500 | $81,100 | $299,400 |
| 2021 | $4,515 | $326,500 | $77,100 | $249,400 |
| 2020 | $4,033 | $279,100 | $76,000 | $203,100 |
| 2019 | $3,413 | $234,100 | $73,200 | $160,900 |
| 2018 | $2,977 | $203,600 | $79,300 | $124,300 |
| 2017 | $2,799 | $199,900 | $75,600 | $124,300 |
| 2016 | $2,748 | $201,600 | $80,400 | $121,200 |
| 2015 | $2,637 | $201,600 | $80,400 | $121,200 |
| 2014 | $2,653 | $210,900 | $78,000 | $132,900 |
Source: Public Records
Map
Nearby Homes
- 11 Dyer St
- 327 Brownell St
- 909 High St Unit 1
- 889 High St
- 33-35 Malvey St
- 10 N Court St Unit 3
- 267 Lincoln Ave
- 750 Davol St Unit 1012
- 750 Davol St Unit 219
- 750 Davol St Unit 221
- 750 Davol St Unit 616
- 750 Davol St Unit 214
- 72 Belmont St
- 575 N Main St
- 302 Cory St
- 503 Highland Ave
- 376 N Underwood St
- 339 Danforth St Unit 6
- 337 Danforth St Unit 7
- 213 Weetamoe St
- 285 Barnaby St
- 624 June St
- 634 June St
- 612 June St
- 271 Barnaby St Unit 3
- 271 Barnaby St Unit 2
- 271 Barnaby St
- 271-273 Barnaby St
- 294 Barnaby St
- 646 June St
- 306 Barnaby St
- 602 June St
- 273 Barnaby St Unit 3
- 273 Barnaby St
- 280-282 Barnaby St Unit 2
- 280-282 Barnaby St Unit 1
- 280-282 Barnaby St Unit 3
- 280-282 Barnaby St
- 324 Barnaby St
- 324 Barnaby St Unit 3
Your Personal Tour Guide
Ask me questions while you tour the home.