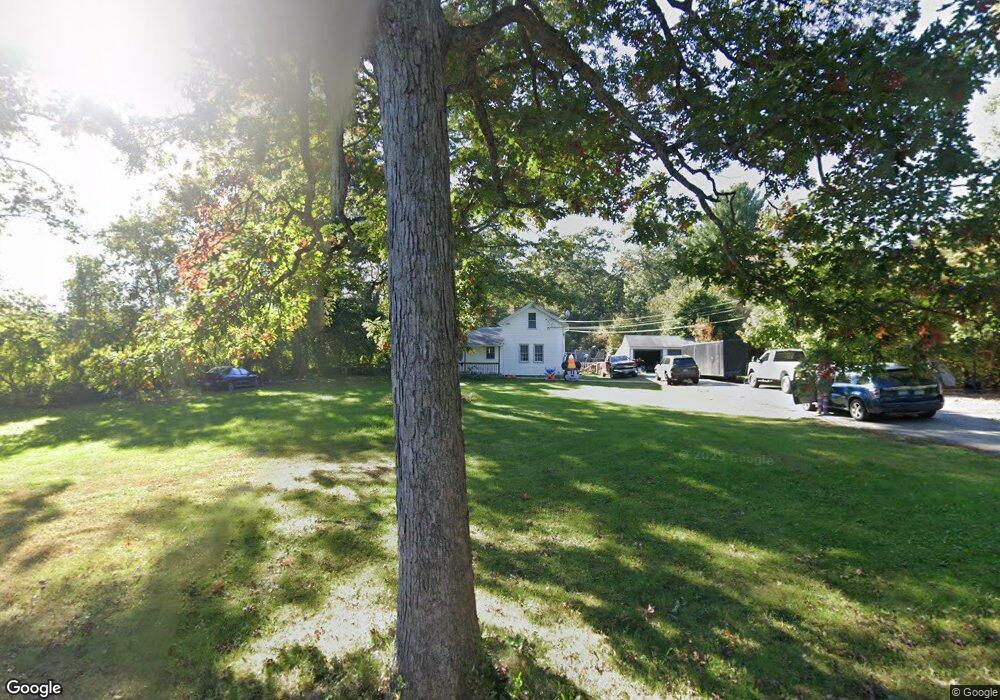
297 Chewink Rd Chaplin, CT 06235
Estimated Value: $258,000 - $362,000
3
Beds
1
Bath
1,013
Sq Ft
$305/Sq Ft
Est. Value
About This Home
This home is located at 297 Chewink Rd, Chaplin, CT 06235 and is currently estimated at $308,948, approximately $304 per square foot. 297 Chewink Rd is a home located in Windham County with nearby schools including Chaplin Elementary School and Parish Hill High School.
Ownership History
Date
Name
Owned For
Owner Type
Purchase Details
Closed on
Mar 31, 2008
Sold by
Baiocchetti Nancy
Bought by
Hovey Walter A
Current Estimated Value
Home Financials for this Owner
Home Financials are based on the most recent Mortgage that was taken out on this home.
Original Mortgage
$217,500
Outstanding Balance
$135,644
Interest Rate
5.76%
Estimated Equity
$173,304
Purchase Details
Closed on
Jan 19, 2006
Sold by
Maurice Robert S and Bubucis Arnis
Bought by
Baiocchetti Nancy
Home Financials for this Owner
Home Financials are based on the most recent Mortgage that was taken out on this home.
Original Mortgage
$156,000
Interest Rate
6.33%
Purchase Details
Closed on
Sep 19, 2005
Sold by
Delorme-Stygar Anita
Bought by
Maurice Robert S and Bubucis Arnis
Purchase Details
Closed on
Nov 29, 1999
Sold by
Delorme Homer
Bought by
Delorme-Stygar Anita and Tewksbury Wayne
Home Financials for this Owner
Home Financials are based on the most recent Mortgage that was taken out on this home.
Original Mortgage
$61,000
Interest Rate
7.77%
Create a Home Valuation Report for This Property
The Home Valuation Report is an in-depth analysis detailing your home's value as well as a comparison with similar homes in the area
Home Values in the Area
Average Home Value in this Area
Purchase History
| Date | Buyer | Sale Price | Title Company |
|---|---|---|---|
| Hovey Walter A | $217,500 | -- | |
| Baiocchetti Nancy | $195,000 | -- | |
| Maurice Robert S | $120,000 | -- | |
| Delorme-Stygar Anita | $56,000 | -- |
Source: Public Records
Mortgage History
| Date | Status | Borrower | Loan Amount |
|---|---|---|---|
| Open | Delorme-Stygar Anita | $217,500 | |
| Previous Owner | Delorme-Stygar Anita | $156,000 | |
| Previous Owner | Delorme-Stygar Anita | $39,000 | |
| Previous Owner | Delorme-Stygar Anita | $61,000 |
Source: Public Records
Tax History
| Year | Tax Paid | Tax Assessment Tax Assessment Total Assessment is a certain percentage of the fair market value that is determined by local assessors to be the total taxable value of land and additions on the property. | Land | Improvement |
|---|---|---|---|---|
| 2025 | $4,092 | $130,400 | $31,100 | $99,300 |
| 2024 | $3,905 | $130,400 | $31,100 | $99,300 |
| 2023 | $3,543 | $99,800 | $28,100 | $71,700 |
| 2022 | $3,443 | $99,800 | $28,100 | $71,700 |
| 2021 | $3,244 | $99,800 | $28,100 | $71,700 |
| 2020 | $3,244 | $99,800 | $28,100 | $71,700 |
| 2019 | $3,244 | $99,800 | $28,100 | $71,700 |
| 2018 | $3,273 | $100,700 | $28,100 | $72,600 |
| 2017 | $3,530 | $100,700 | $28,100 | $72,600 |
| 2016 | $3,530 | $100,700 | $28,100 | $72,600 |
| 2015 | $3,676 | $100,700 | $28,100 | $72,600 |
| 2014 | $3,676 | $100,700 | $28,100 | $72,600 |
Source: Public Records
Map
Nearby Homes
- 0 Scotland Rd Unit 24160798
- 81 Chappell St
- 0 Hampton Rd Unit 170523717
- 771 Brook Rd
- 769 Brook Rd
- 11 Mountain Laurel Ln
- 890 Brook Rd
- 13 Bates Rd
- 366 Hartford Turnpike
- 404 Bassetts Bridge Rd
- 69 N Bedlam Rd
- 6 Skyline Dr
- 349 S Bigelow Rd
- 0 Providence Turnpike Unit 24160702
- 310 S Bigelow Rd
- 23 James Dr
- 5 Woods Way Unit WOOD005
- 16 Circle Dr
- 64 Circle Dr
- 17 Carolyn Ln
- 289 Chewink Rd
- 304 Chewink Rd
- 281 Chewink Rd
- 329 Chewink Rd
- 253 Chewink Rd
- 241 Chewink Rd
- 254 Lynch Rd
- 242 Lynch Rd
- 232 Lynch Rd
- 221 Chewink Rd
- 0 Scotland Rd Unit 24064003
- 0 Scotland Rd Unit 170271581
- 213 Chewink Rd
- 3 Scotland Rd
- 194 Chewink Rd
- 160 Lynch Rd
- 184 Chewink Rd
- 173 Chewink Rd
- 60 Scotland Rd
- 150 Lynch Rd
Your Personal Tour Guide
Ask me questions while you tour the home.