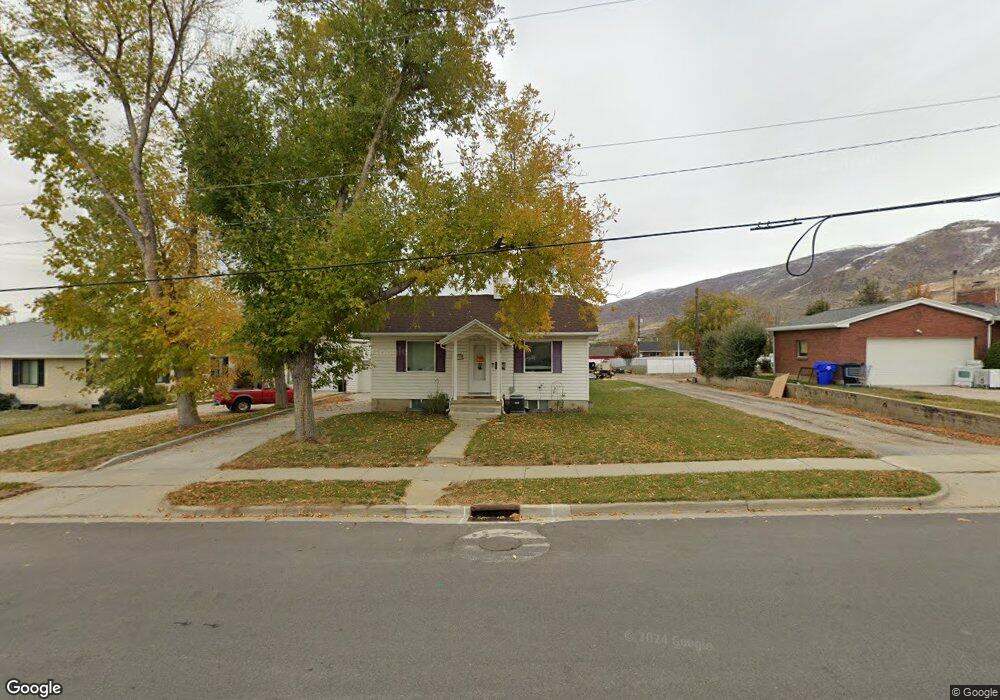
297 E 900 N Bountiful, UT 84010
Estimated Value: $449,000 - $625,000
3
Beds
2
Baths
840
Sq Ft
$604/Sq Ft
Est. Value
About This Home
This home is located at 297 E 900 N, Bountiful, UT 84010 and is currently estimated at $507,198, approximately $603 per square foot. 297 E 900 N is a home located in Davis County with nearby schools including Tolman School, Bountiful Junior High School, and Viewmont High School.
Ownership History
Date
Name
Owned For
Owner Type
Purchase Details
Closed on
Jan 14, 2016
Sold by
Bountiful Peak Office Lp
Bought by
Bountiful Peak 1 Llc
Current Estimated Value
Purchase Details
Closed on
Feb 17, 2006
Sold by
Bountiful Peak Office Lp
Bought by
Bountiful Peak Office Lp
Purchase Details
Closed on
Oct 24, 2005
Sold by
Bountiful Peak Office Lp
Bought by
Bountiful Peak Office Lp
Purchase Details
Closed on
Jan 25, 2005
Sold by
Hoel Gerald B and Hoel Wilma R
Bought by
Jogern Wiliam T and Jogern Rebecca
Purchase Details
Closed on
Aug 9, 2004
Sold by
Blaisdell Mark H and Blaisdell Debra G
Bought by
Bountiful Peak Office Lp
Create a Home Valuation Report for This Property
The Home Valuation Report is an in-depth analysis detailing your home's value as well as a comparison with similar homes in the area
Purchase History
| Date | Buyer | Sale Price | Title Company |
|---|---|---|---|
| Bountiful Peak 1 Llc | -- | -- | |
| Bountiful Peak Office Lp | -- | None Available | |
| Bountiful Peak Office Lp | -- | -- | |
| Jogern Wiliam T | -- | None Available | |
| Bountiful Peak Office Lp | -- | -- |
Source: Public Records
Tax History
| Year | Tax Paid | Tax Assessment Tax Assessment Total Assessment is a certain percentage of the fair market value that is determined by local assessors to be the total taxable value of land and additions on the property. | Land | Improvement |
|---|---|---|---|---|
| 2025 | $2,799 | $237,050 | $168,802 | $68,248 |
| 2024 | $2,644 | $233,749 | $164,645 | $69,104 |
| 2023 | $2,536 | $224,400 | $159,783 | $64,616 |
| 2022 | $2,643 | $426,000 | $282,555 | $143,445 |
| 2021 | $2,499 | $342,000 | $203,892 | $138,108 |
| 2020 | $2,093 | $283,000 | $169,731 | $113,269 |
| 2019 | $2,037 | $268,000 | $151,801 | $116,199 |
| 2018 | $1,877 | $241,000 | $148,227 | $92,773 |
| 2016 | $1,695 | $118,580 | $69,402 | $49,178 |
| 2015 | $1,648 | $108,570 | $69,402 | $39,168 |
| 2014 | $1,558 | $105,566 | $69,402 | $36,164 |
| 2013 | -- | $106,744 | $49,548 | $57,196 |
Source: Public Records
Map
Nearby Homes
- 282 E 1400 N
- 453 N 400 E Unit 7-D
- 1420 N Main St
- 662 E 1200 N
- 345 N 400 E
- 93 W 700 N
- 106 W 700 N
- 610 E Pages Ln
- 967 S Courtyard Ln
- 184 Park Shadows Cir
- 1130 N 200 W
- 1260 N 200 W
- 49 E 200 N Unit 4
- 41 E 200 N Unit 6
- 252 N Main St
- 256 N Main St
- 254 N Main St
- 55 E 200 N Unit 2
- 51 E 200 N Unit 3
- 96 Village Square Rd
Your Personal Tour Guide
Ask me questions while you tour the home.