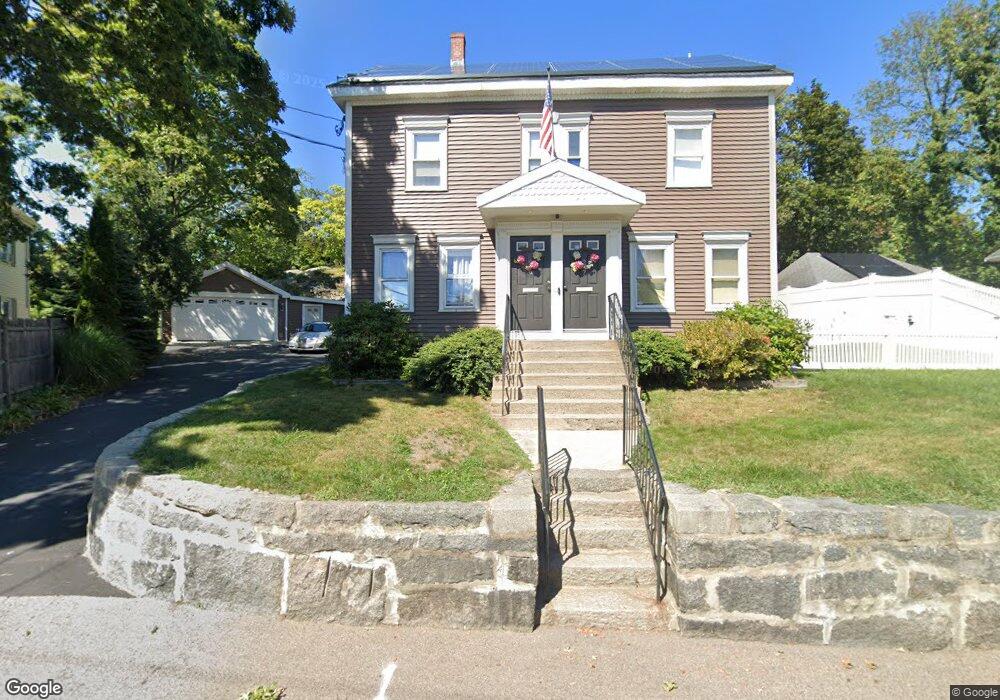
297 Granite St Quincy, MA 02169
South Quincy NeighborhoodEstimated Value: $827,000 - $1,041,000
5
Beds
3
Baths
2,672
Sq Ft
$354/Sq Ft
Est. Value
About This Home
This home is located at 297 Granite St, Quincy, MA 02169 and is currently estimated at $945,333, approximately $353 per square foot. 297 Granite St is a home located in Norfolk County with nearby schools including Lincoln-Hancock Community School, South West Middle School, and Quincy High School.
Ownership History
Date
Name
Owned For
Owner Type
Purchase Details
Closed on
Jul 3, 1992
Sold by
Ehrstein Lina V
Bought by
Johnson Harry A and Johnson Helvi A
Current Estimated Value
Home Financials for this Owner
Home Financials are based on the most recent Mortgage that was taken out on this home.
Original Mortgage
$104,000
Interest Rate
8.49%
Mortgage Type
Commercial
Create a Home Valuation Report for This Property
The Home Valuation Report is an in-depth analysis detailing your home's value as well as a comparison with similar homes in the area
Home Values in the Area
Average Home Value in this Area
Purchase History
| Date | Buyer | Sale Price | Title Company |
|---|---|---|---|
| Johnson Harry A | $130,000 | -- |
Source: Public Records
Mortgage History
| Date | Status | Borrower | Loan Amount |
|---|---|---|---|
| Open | Johnson Harry A | $105,000 | |
| Closed | Johnson Harry A | $104,000 |
Source: Public Records
Tax History Compared to Growth
Tax History
| Year | Tax Paid | Tax Assessment Tax Assessment Total Assessment is a certain percentage of the fair market value that is determined by local assessors to be the total taxable value of land and additions on the property. | Land | Improvement |
|---|---|---|---|---|
| 2025 | $11,075 | $960,500 | $317,900 | $642,600 |
| 2024 | $10,527 | $934,100 | $303,100 | $631,000 |
| 2023 | $9,603 | $862,800 | $276,300 | $586,500 |
| 2022 | $9,324 | $778,300 | $231,500 | $546,800 |
| 2021 | $9,300 | $766,100 | $231,500 | $534,600 |
| 2020 | $8,976 | $722,100 | $231,500 | $490,600 |
| 2019 | $8,889 | $708,300 | $218,900 | $489,400 |
| 2018 | $7,666 | $574,700 | $203,300 | $371,400 |
| 2017 | $7,792 | $549,900 | $193,900 | $356,000 |
| 2016 | $6,990 | $486,800 | $169,700 | $317,100 |
| 2015 | $6,979 | $478,000 | $169,700 | $308,300 |
| 2014 | $6,424 | $432,300 | $169,700 | $262,600 |
Source: Public Records
Map
Nearby Homes
- 64 Garfield St Unit B
- 91 Garfield St
- 51 Brook Rd
- 94 Brook Rd Unit 3
- 21 Arthur St
- 118 Brook Rd Unit 2
- 12 Arthur Ave
- 14 Arthur Ave
- 76 Scotch Pond Place Unit 76
- 73 Scotch Pond Place
- 8 Jackson St Unit B2
- 46 Suomi Rd
- 46 Suomi Rd Unit 46
- 46-48 Buckley St
- 57 Buckley St
- 56 Penn St Unit 4
- 50 N Payne St Unit 1
- 50 N Payne St Unit 3
- 42 West St
- 72 Federal Ave
- 301 Granite St
- 289 Granite St
- 307 Granite St
- 22 Garfield St Unit 24
- 279 Granite St
- 26 Garfield St
- 267 Granite St
- 313 Granite St
- 54 Kidder St
- 18 Garfield St
- 16 Garfield St
- 18 Garfield St Unit 4,18
- 36 Garfield St
- 14 Garfield St
- 12 Garfield St
- 14 Garfield St Unit 14
- 12 Garfield St Unit 12
- 48 Kidder St
- 50 Kidder St Unit 1
- 257 Granite St