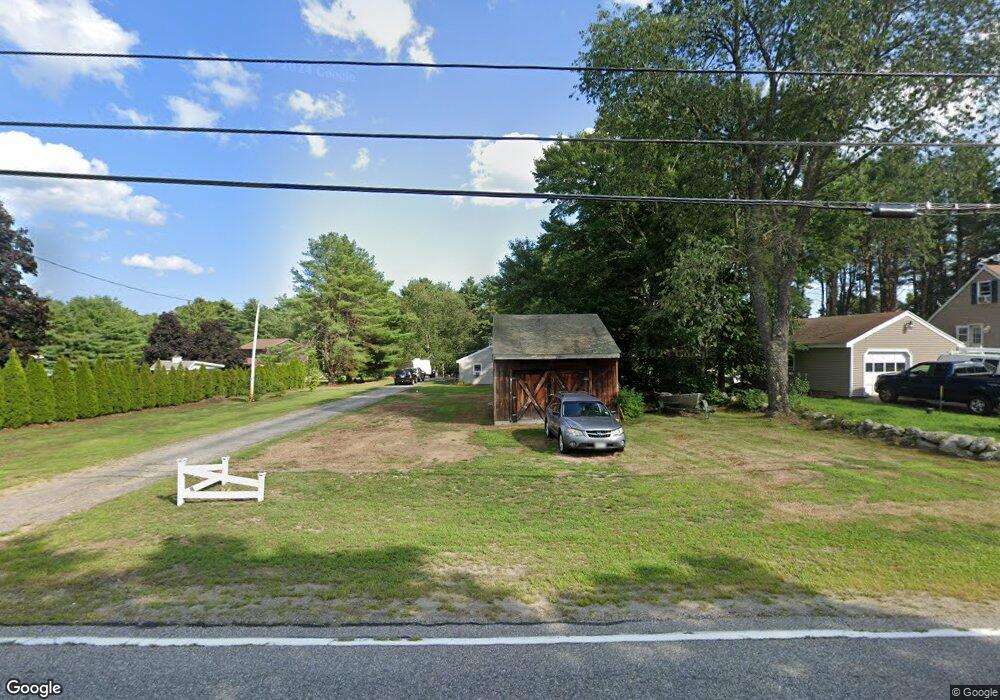
297 Guinea Rd Biddeford, ME 04005
South Biddeford NeighborhoodEstimated Value: $408,000 - $468,000
3
Beds
1
Bath
1,100
Sq Ft
$391/Sq Ft
Est. Value
About This Home
This home is located at 297 Guinea Rd, Biddeford, ME 04005 and is currently estimated at $429,994, approximately $390 per square foot. 297 Guinea Rd is a home located in York County with nearby schools including John F Kennedy Memorial School, Biddeford Primary School, and Biddeford Intermediate School.
Ownership History
Date
Name
Owned For
Owner Type
Purchase Details
Closed on
Dec 14, 2017
Sold by
Mark R Nadeau Lt
Bought by
Perkins Darcie C and Perkins Ryan W
Current Estimated Value
Home Financials for this Owner
Home Financials are based on the most recent Mortgage that was taken out on this home.
Original Mortgage
$171,830
Outstanding Balance
$146,033
Interest Rate
3.94%
Mortgage Type
FHA
Estimated Equity
$283,961
Purchase Details
Closed on
Aug 17, 2015
Sold by
Nadeau Mark R
Bought by
Mark R Nadeau Lt
Create a Home Valuation Report for This Property
The Home Valuation Report is an in-depth analysis detailing your home's value as well as a comparison with similar homes in the area
Home Values in the Area
Average Home Value in this Area
Purchase History
| Date | Buyer | Sale Price | Title Company |
|---|---|---|---|
| Perkins Darcie C | -- | -- | |
| Mark R Nadeau Lt | -- | -- |
Source: Public Records
Mortgage History
| Date | Status | Borrower | Loan Amount |
|---|---|---|---|
| Open | Perkins Darcie C | $171,830 |
Source: Public Records
Tax History Compared to Growth
Tax History
| Year | Tax Paid | Tax Assessment Tax Assessment Total Assessment is a certain percentage of the fair market value that is determined by local assessors to be the total taxable value of land and additions on the property. | Land | Improvement |
|---|---|---|---|---|
| 2024 | $4,321 | $303,900 | $165,600 | $138,300 |
| 2023 | $3,987 | $303,900 | $165,600 | $138,300 |
| 2022 | $3,799 | $231,500 | $108,000 | $123,500 |
| 2021 | $3,575 | $196,100 | $90,200 | $105,900 |
| 2020 | $3,431 | $171,100 | $73,500 | $97,600 |
| 2019 | $3,419 | $171,100 | $73,500 | $97,600 |
| 2018 | $3,371 | $171,100 | $73,500 | $97,600 |
| 2017 | $3,366 | $167,700 | $73,500 | $94,200 |
| 2016 | $3,331 | $167,700 | $73,500 | $94,200 |
| 2015 | $3,265 | $167,700 | $73,500 | $94,200 |
| 2014 | $3,185 | $167,700 | $73,500 | $94,200 |
| 2013 | -- | $168,500 | $69,300 | $99,200 |
Source: Public Records
Map
Nearby Homes