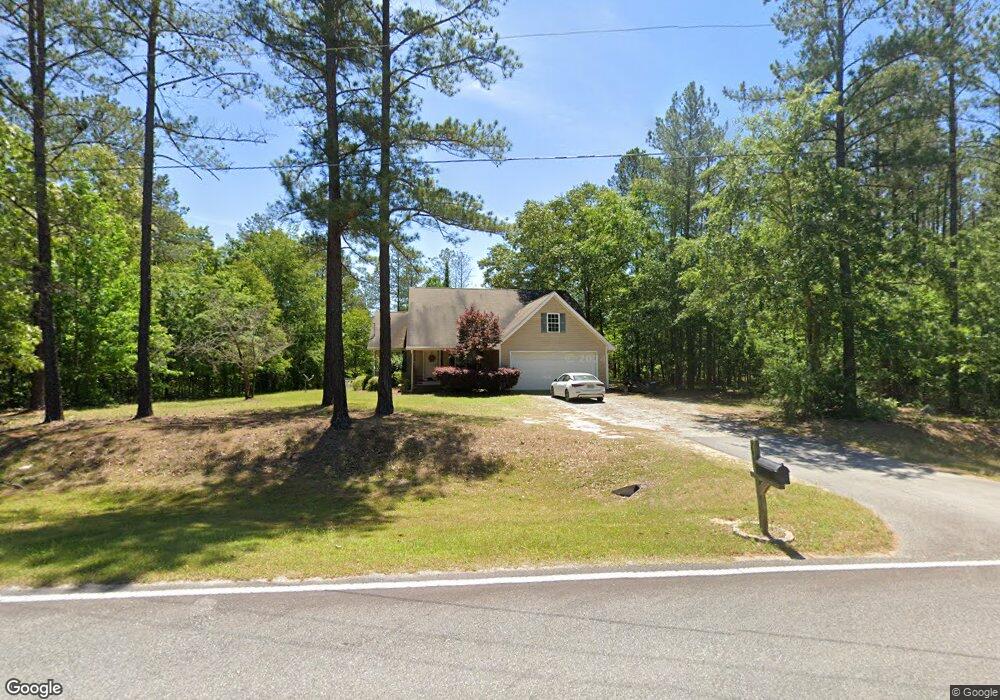
297 Kimberly Ln S Unit 4L Gordon, GA 31031
Estimated Value: $206,000 - $358,000
3
Beds
2
Baths
1,914
Sq Ft
$139/Sq Ft
Est. Value
About This Home
This home is located at 297 Kimberly Ln S Unit 4L, Gordon, GA 31031 and is currently estimated at $266,837, approximately $139 per square foot. 297 Kimberly Ln S Unit 4L is a home located in Wilkinson County with nearby schools including Wilkinson County Primary School, Wilkinson County Elementary School, and Wilkinson County Middle School.
Ownership History
Date
Name
Owned For
Owner Type
Purchase Details
Closed on
Jun 26, 2019
Sold by
Adams Jo Ann L
Bought by
Hardie Ashley Elizabeth
Current Estimated Value
Home Financials for this Owner
Home Financials are based on the most recent Mortgage that was taken out on this home.
Original Mortgage
$145,454
Outstanding Balance
$127,640
Interest Rate
3.9%
Mortgage Type
New Conventional
Estimated Equity
$114,290
Purchase Details
Closed on
May 28, 2009
Sold by
Adams Jo Ann L
Bought by
Adams Jo Ann L and Adams Amber R
Home Financials for this Owner
Home Financials are based on the most recent Mortgage that was taken out on this home.
Original Mortgage
$130,000
Interest Rate
4.77%
Mortgage Type
New Conventional
Purchase Details
Closed on
Oct 29, 2004
Sold by
Lamb Paul R and Lamb Jeanette
Bought by
Adams Joann L
Create a Home Valuation Report for This Property
The Home Valuation Report is an in-depth analysis detailing your home's value as well as a comparison with similar homes in the area
Home Values in the Area
Average Home Value in this Area
Purchase History
| Date | Buyer | Sale Price | Title Company |
|---|---|---|---|
| Hardie Ashley Elizabeth | $144,000 | -- | |
| Adams Jo Ann L | -- | -- | |
| Adams Joann L | $8,000 | -- |
Source: Public Records
Mortgage History
| Date | Status | Borrower | Loan Amount |
|---|---|---|---|
| Open | Hardie Ashley Elizabeth | $145,454 | |
| Previous Owner | Adams Jo Ann L | $130,000 |
Source: Public Records
Tax History Compared to Growth
Tax History
| Year | Tax Paid | Tax Assessment Tax Assessment Total Assessment is a certain percentage of the fair market value that is determined by local assessors to be the total taxable value of land and additions on the property. | Land | Improvement |
|---|---|---|---|---|
| 2024 | $2,190 | $67,295 | $4,080 | $63,215 |
| 2023 | $1,844 | $54,156 | $1,820 | $52,336 |
| 2022 | $1,803 | $52,956 | $1,820 | $51,136 |
| 2021 | $1,822 | $52,956 | $1,820 | $51,136 |
| 2020 | $1,824 | $52,956 | $1,820 | $51,136 |
| 2019 | $1,822 | $52,956 | $1,820 | $51,136 |
| 2018 | $1,822 | $52,956 | $1,820 | $51,136 |
| 2017 | $1,700 | $52,956 | $1,820 | $51,136 |
| 2016 | $1,700 | $52,956 | $1,820 | $51,136 |
| 2015 | $1,599 | $52,956 | $1,820 | $51,136 |
| 2014 | $1,599 | $52,956 | $1,820 | $51,136 |
| 2013 | $1,599 | $52,956 | $1,820 | $51,136 |
Source: Public Records
Map
Nearby Homes
- 1300 Johns Golden Rd
- 0 Laurel Branch Rd Unit 10587149
- 310 Gordon Hwy SW
- 0 Black Creek Rd
- 107 Forest Valley Dr
- 101 Lilac Ct SE
- 223 Old Stage Dr SW
- 118 Carl Vinson Rd SE
- 2521 Vinson Hwy SE
- 2140 Nesmith Rd
- 156 Jf Hall Rd
- 154 Jf Hall Rd
- 158 Thomas Field Rd SE
- 2445 Irwinton Rd
- 154 Jf Hall Rd
- 88 Caroline Dr
- 138 Deacon J Simmons Rd SW
- 394 Broad St
- 135 Ramsey St SW
- 106 3rd St