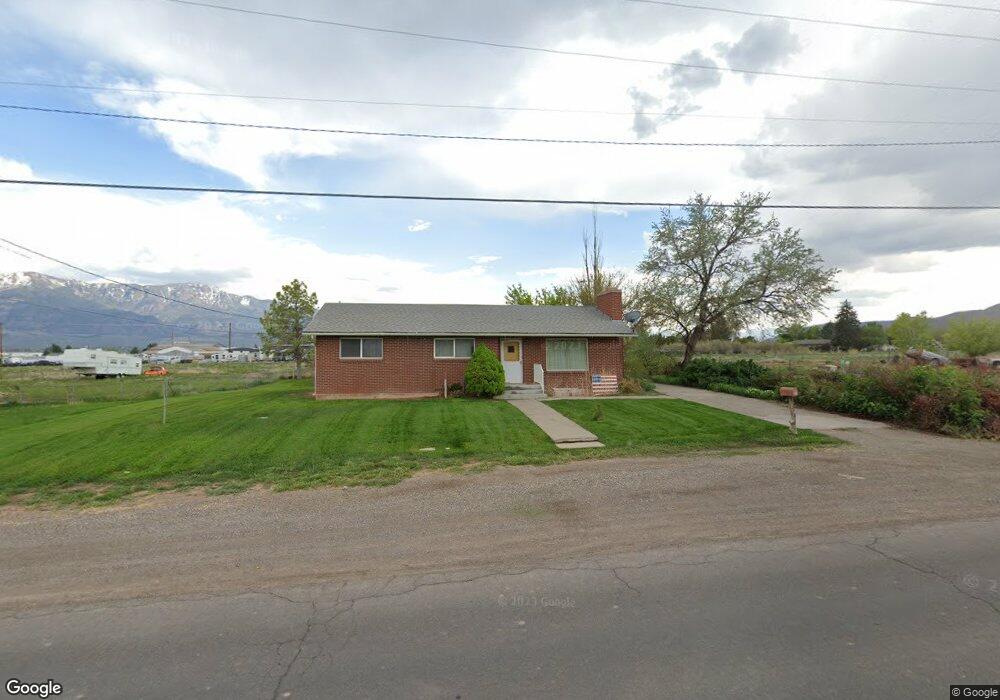
297 W 800 S Richfield, UT 84701
Estimated Value: $264,000 - $319,000
--
Bed
1
Bath
1,222
Sq Ft
$246/Sq Ft
Est. Value
About This Home
This home is located at 297 W 800 S, Richfield, UT 84701 and is currently estimated at $300,321, approximately $245 per square foot. 297 W 800 S is a home located in Sevier County with nearby schools including Ashman School, Pahvant School, and Red Hills Middle School.
Ownership History
Date
Name
Owned For
Owner Type
Purchase Details
Closed on
Feb 20, 2015
Sold by
Laybourn Margaret Rose and Mckie Pamela K
Bought by
Barney Beau Zachary
Current Estimated Value
Home Financials for this Owner
Home Financials are based on the most recent Mortgage that was taken out on this home.
Original Mortgage
$153,225
Outstanding Balance
$116,924
Interest Rate
3.66%
Mortgage Type
VA
Estimated Equity
$183,397
Purchase Details
Closed on
Feb 19, 2015
Sold by
Nelson Peggy Marie Hunt and Barney Marsha Lee Hunt
Bought by
Barney Beau Zachary
Home Financials for this Owner
Home Financials are based on the most recent Mortgage that was taken out on this home.
Original Mortgage
$153,225
Outstanding Balance
$116,924
Interest Rate
3.66%
Mortgage Type
VA
Estimated Equity
$183,397
Purchase Details
Closed on
Mar 1, 2005
Sold by
Mckie Pamela K Hunt and Nelson Peggy Marie Hunt
Bought by
Scott Delrae and Scott Tiffanie
Create a Home Valuation Report for This Property
The Home Valuation Report is an in-depth analysis detailing your home's value as well as a comparison with similar homes in the area
Home Values in the Area
Average Home Value in this Area
Purchase History
| Date | Buyer | Sale Price | Title Company |
|---|---|---|---|
| Barney Beau Zachary | -- | Land Title | |
| Barney Beau Zachary | -- | D Land Title | |
| Barney Beau Zachary | -- | D Land Title | |
| Scott Delrae | -- | None Available |
Source: Public Records
Mortgage History
| Date | Status | Borrower | Loan Amount |
|---|---|---|---|
| Open | Barney Beau Zachary | $153,225 | |
| Closed | Barney Beau Zachary | $153,225 |
Source: Public Records
Tax History Compared to Growth
Tax History
| Year | Tax Paid | Tax Assessment Tax Assessment Total Assessment is a certain percentage of the fair market value that is determined by local assessors to be the total taxable value of land and additions on the property. | Land | Improvement |
|---|---|---|---|---|
| 2024 | $1,501 | $151,723 | $44,032 | $107,691 |
| 2023 | $1,579 | $157,916 | $40,941 | $116,975 |
| 2022 | $1,458 | $133,135 | $40,165 | $92,970 |
| 2021 | $1,372 | $105,433 | $36,205 | $69,228 |
| 2020 | $1,234 | $92,223 | $23,522 | $68,701 |
| 2019 | $1,048 | $82,870 | $19,600 | $63,270 |
| 2018 | $1,047 | $74,190 | $19,600 | $54,590 |
| 2017 | $1,017 | $68,760 | $19,600 | $49,160 |
| 2016 | $836 | $68,760 | $0 | $0 |
| 2015 | $836 | $65,380 | $0 | $0 |
| 2014 | $836 | $62,370 | $0 | $0 |
Source: Public Records
Map
Nearby Homes
- 0 Parcel #1-7-73 Unit 25-261286
- 250 W 700 S
- 528 W 650 S
- 554 W 1000 S
- 553 S 100 W Unit 202
- 812 610 W
- 73 W 500 S Unit 104
- 73 W 500 S Unit 103
- 73 W 500 S Unit 304
- 73 W 500 S Unit 203
- 73 W 500 S Unit 202
- 73 W 500 S Unit 101
- 669 Ogden Dr
- 690 1100 S
- 1170 S Cove View Rd
- 280 S 100 W
- 143 W 200 S
- 210 S 500 W
- 911 W 1080 S
- 0 Parcel #1-2-57 Unit 25-261285