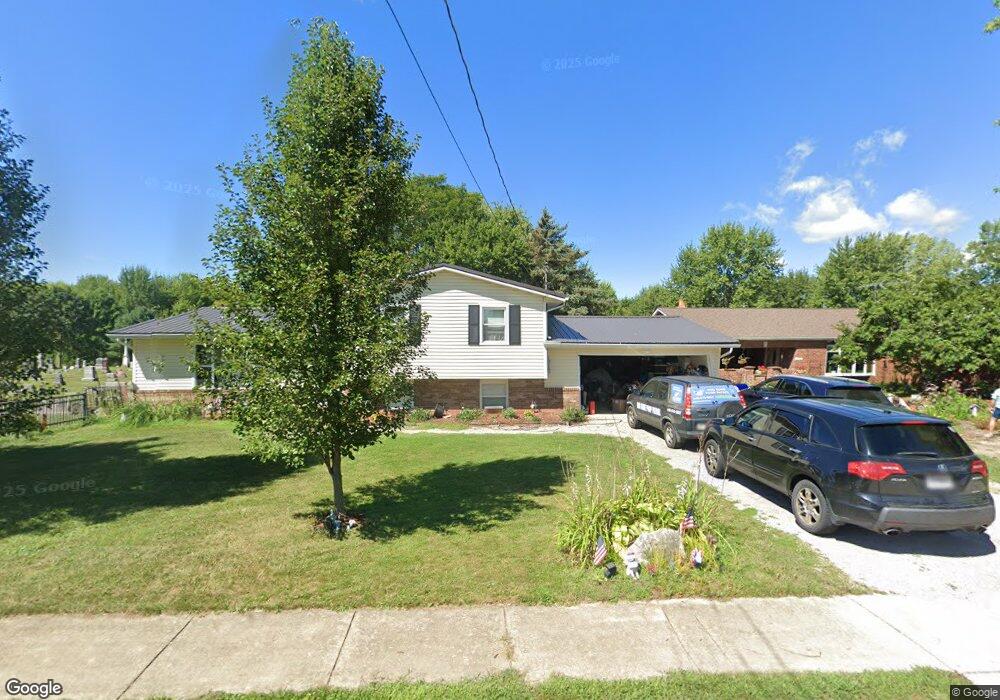
297 West St Lagrange, OH 44050
Estimated Value: $247,000 - $304,000
3
Beds
1
Bath
1,872
Sq Ft
$143/Sq Ft
Est. Value
About This Home
This home is located at 297 West St, Lagrange, OH 44050 and is currently estimated at $268,587, approximately $143 per square foot. 297 West St is a home located in Lorain County with nearby schools including Keystone Elementary School, Keystone Middle School, and Keystone High School.
Ownership History
Date
Name
Owned For
Owner Type
Purchase Details
Closed on
May 21, 2020
Sold by
Rastetter Padin Cari A
Bought by
Rastetter Padin Cari A and Padin Ramon
Current Estimated Value
Purchase Details
Closed on
Feb 5, 2004
Sold by
Borkowski W Carl
Bought by
Rastetter Padin Cari A and Haas Virginia H
Home Financials for this Owner
Home Financials are based on the most recent Mortgage that was taken out on this home.
Original Mortgage
$135,900
Outstanding Balance
$63,958
Interest Rate
5.88%
Mortgage Type
FHA
Estimated Equity
$204,629
Purchase Details
Closed on
Jun 11, 1999
Sold by
Storl Gerhard and Storl Elfriede
Bought by
Borkowski W Carl
Home Financials for this Owner
Home Financials are based on the most recent Mortgage that was taken out on this home.
Original Mortgage
$80,000
Interest Rate
6.12%
Create a Home Valuation Report for This Property
The Home Valuation Report is an in-depth analysis detailing your home's value as well as a comparison with similar homes in the area
Home Values in the Area
Average Home Value in this Area
Purchase History
| Date | Buyer | Sale Price | Title Company |
|---|---|---|---|
| Rastetter Padin Cari A | -- | First Meridian Title Agency | |
| Rastetter Padin Cari A | $137,000 | Home Town Usa Title Agency | |
| Borkowski W Carl | $106,000 | Real Estate Title Service Co |
Source: Public Records
Mortgage History
| Date | Status | Borrower | Loan Amount |
|---|---|---|---|
| Open | Rastetter Padin Cari A | $135,900 | |
| Previous Owner | Borkowski W Carl | $80,000 |
Source: Public Records
Tax History Compared to Growth
Tax History
| Year | Tax Paid | Tax Assessment Tax Assessment Total Assessment is a certain percentage of the fair market value that is determined by local assessors to be the total taxable value of land and additions on the property. | Land | Improvement |
|---|---|---|---|---|
| 2024 | $3,071 | $72,447 | $11,221 | $61,226 |
| 2023 | $2,529 | $49,833 | $12,037 | $37,797 |
| 2022 | $2,512 | $49,833 | $12,037 | $37,797 |
| 2021 | $2,513 | $49,833 | $12,037 | $37,797 |
| 2020 | $2,293 | $40,520 | $9,790 | $30,730 |
| 2019 | $2,280 | $40,520 | $9,790 | $30,730 |
| 2018 | $2,292 | $40,520 | $9,790 | $30,730 |
| 2017 | $2,383 | $41,090 | $7,170 | $33,920 |
| 2016 | $2,367 | $41,090 | $7,170 | $33,920 |
| 2015 | $2,364 | $41,090 | $7,170 | $33,920 |
| 2014 | $1,831 | $36,050 | $6,290 | $29,760 |
| 2013 | $1,776 | $36,050 | $6,290 | $29,760 |
Source: Public Records
Map
Nearby Homes
- 171 Keywood Blvd
- 433 N Center St
- 110 Railroad St
- 128 Harvest Ct
- 194 Railroad St
- 516 Appomattox Ct
- 548 William St
- 0 Dill Ct Unit 5072837
- 607 Rundle St
- 756 N Center St
- 630 Rundle St
- 40725 Biggs Rd
- 808 Buckingham Dr
- 822 Robinson Dr
- 829 Robinson Dr
- 831 Robinson Dr
- 800 Buckingham Dr
- 19045 Whitehead Rd
- 41635 Parsons Rd
- 131 Walleye Ct