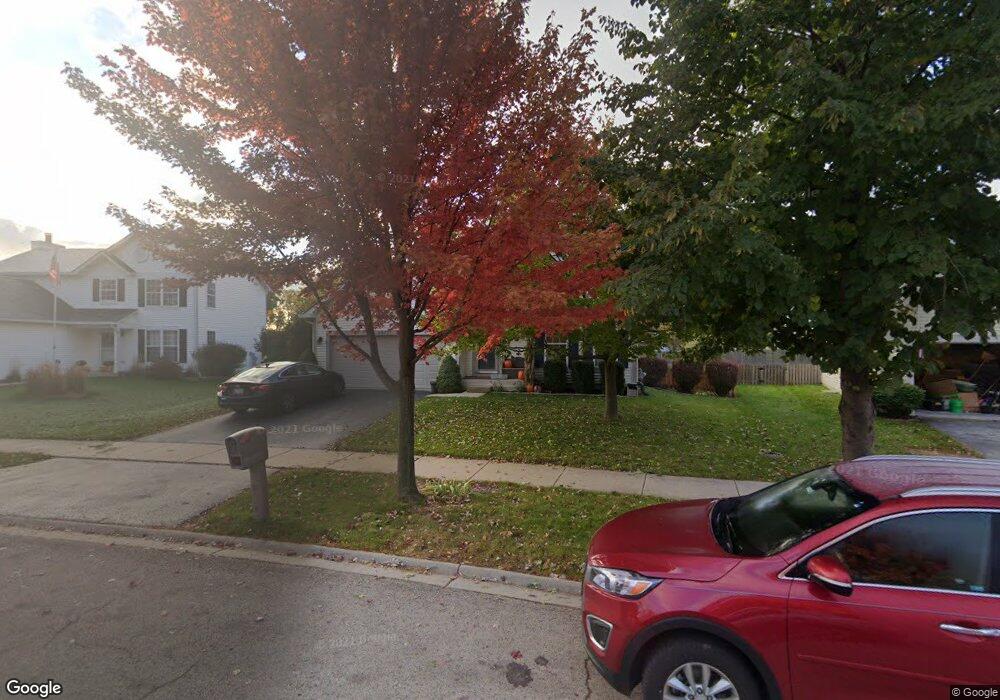
2971 Carlsbad Cir Unit 6 Aurora, IL 60503
Far Southeast NeighborhoodEstimated Value: $345,797 - $483,000
--
Bed
1
Bath
1,652
Sq Ft
$248/Sq Ft
Est. Value
About This Home
This home is located at 2971 Carlsbad Cir Unit 6, Aurora, IL 60503 and is currently estimated at $409,449, approximately $247 per square foot. 2971 Carlsbad Cir Unit 6 is a home located in Will County with nearby schools including Wolfs Crossing Elementary School, Bednarcik Jr. High School, and Oswego East High School.
Ownership History
Date
Name
Owned For
Owner Type
Purchase Details
Closed on
Jul 28, 2004
Sold by
Fawver John E and Fawver Michelle M
Bought by
Marruffo Cyndi L
Current Estimated Value
Home Financials for this Owner
Home Financials are based on the most recent Mortgage that was taken out on this home.
Original Mortgage
$185,600
Outstanding Balance
$138,306
Interest Rate
6.1%
Mortgage Type
Credit Line Revolving
Estimated Equity
$271,143
Purchase Details
Closed on
Aug 9, 2001
Sold by
Lakewood Valley Phase Ii Llc
Bought by
Fawyer John E and Smith Michelle M
Home Financials for this Owner
Home Financials are based on the most recent Mortgage that was taken out on this home.
Original Mortgage
$173,300
Interest Rate
7.28%
Create a Home Valuation Report for This Property
The Home Valuation Report is an in-depth analysis detailing your home's value as well as a comparison with similar homes in the area
Home Values in the Area
Average Home Value in this Area
Purchase History
| Date | Buyer | Sale Price | Title Company |
|---|---|---|---|
| Marruffo Cyndi L | $232,000 | -- | |
| Fawyer John E | $182,500 | Chicago Title Insurance Co |
Source: Public Records
Mortgage History
| Date | Status | Borrower | Loan Amount |
|---|---|---|---|
| Open | Marruffo Cyndi L | $185,600 | |
| Previous Owner | Fawyer John E | $173,300 | |
| Closed | Marruffo Cyndi L | $46,400 |
Source: Public Records
Tax History Compared to Growth
Tax History
| Year | Tax Paid | Tax Assessment Tax Assessment Total Assessment is a certain percentage of the fair market value that is determined by local assessors to be the total taxable value of land and additions on the property. | Land | Improvement |
|---|---|---|---|---|
| 2024 | $7,847 | $98,025 | $23,259 | $74,766 |
| 2023 | $7,847 | $86,595 | $20,547 | $66,048 |
| 2022 | $6,677 | $73,091 | $19,437 | $53,654 |
| 2021 | $6,626 | $69,610 | $18,511 | $51,099 |
| 2020 | $6,340 | $68,507 | $18,218 | $50,289 |
| 2019 | $6,401 | $66,577 | $17,705 | $48,872 |
| 2018 | $5,990 | $60,753 | $17,315 | $43,438 |
| 2017 | $5,922 | $59,185 | $16,868 | $42,317 |
| 2016 | $6,067 | $57,911 | $16,505 | $41,406 |
| 2015 | $6,188 | $55,683 | $15,870 | $39,813 |
| 2014 | $6,188 | $53,160 | $15,870 | $37,290 |
| 2013 | $6,188 | $53,160 | $15,870 | $37,290 |
Source: Public Records
Map
Nearby Homes
- 9836 S Carls Dr
- 2895 Lahinch Ct Unit 6
- 2969 Francis Ct
- 2532 Sagamore Cir
- 2413 Dickens Dr
- 4308 Fraser Cir
- 3218 Lincoln Prairie Blvd
- 3258 Mirehaven Ct
- 3274 Mirehaven Ct
- 3106 Adelwood Cir
- 3150 Adelwood Cir
- 3120 Adelwood Dr
- 3152 Adelwood Cir
- 3156 Adelwood Dr
- 3273 Mirehaven Dr
- 3146 Bellwether Dr
- 3144 Bellwether Dr
- 3150 Bellwether Dr
- 3168 Bellwether Dr
- 3148 Bellwether Dr
- 2975 Carlsbad Cir Unit 6
- 2967 Carlsbad Cir
- 2979 Carlsbad Cir
- 2963 Carlsbad Cir
- 2970 Carlsbad Cir
- 2959 Carlsbad Cir Unit 6
- 2983 Carlsbad Cir Unit 6
- 2978 Carlsbad Cir
- 2962 Carlsbad Cir
- 10022 Bode St
- 10022 Bode St Unit A
- 10022 Bode St Unit 1C
- 10022 Bode St Unit 3-4
- 10022 Bode St Unit 5
- 2982 Carlsbad Cir
- 2955 Carlsbad Cir
- 2958 Carlsbad Cir Unit 6
- 2987 Carlsbad Cir
- 2847 Lindgren Trail Unit 6
- 2951 Carlsbad Cir