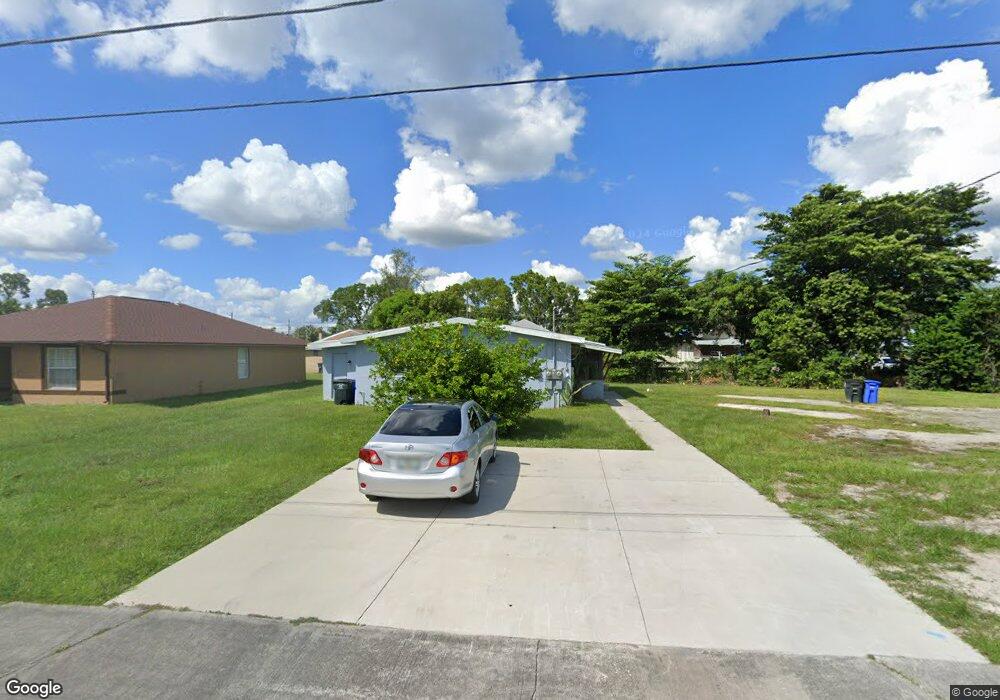
2971 Dunbar St Fort Myers, FL 33916
East Fort Myers NeighborhoodEstimated Value: $224,350 - $367,000
2
Beds
1
Bath
650
Sq Ft
$474/Sq Ft
Est. Value
About This Home
This home is located at 2971 Dunbar St, Fort Myers, FL 33916 and is currently estimated at $308,088, approximately $473 per square foot. 2971 Dunbar St is a home located in Lee County with nearby schools including Edison Park Creative & Expressive Arts School, Allen Park Elementary School, and Orangewood Elementary School.
Ownership History
Date
Name
Owned For
Owner Type
Purchase Details
Closed on
Aug 5, 2013
Sold by
Sababa Holdings Llp
Bought by
Younisian Ami
Current Estimated Value
Purchase Details
Closed on
Jun 11, 2013
Sold by
Whitney Keona
Bought by
Sababa Holdings Llp
Purchase Details
Closed on
May 18, 2013
Sold by
Arnold Anthony and Mcgill Durla
Bought by
Whitney Keona
Purchase Details
Closed on
Oct 12, 2011
Sold by
Arnold Anthony and Mcgill Durla
Bought by
Whitney Keona
Purchase Details
Closed on
Feb 3, 2011
Sold by
Us Bank National Association
Bought by
Meyer Edward Richard and Kalz Kathleen
Purchase Details
Closed on
Dec 28, 2010
Sold by
Arnold Anthony Lester
Bought by
Us Bank National Association
Purchase Details
Closed on
Mar 14, 2006
Sold by
Arnold Anthony Lester and Mcgill Durla M
Bought by
Arnold Anthony Lester and Mcgill Durla M
Create a Home Valuation Report for This Property
The Home Valuation Report is an in-depth analysis detailing your home's value as well as a comparison with similar homes in the area
Home Values in the Area
Average Home Value in this Area
Purchase History
| Date | Buyer | Sale Price | Title Company |
|---|---|---|---|
| Younisian Ami | $45,000 | Realty Title Solutions Lllp | |
| Sababa Holdings Llp | $26,500 | Realty Title Solutions Lllp | |
| Whitney Keona | -- | Realty Title Solutions Lllp | |
| Whitney Keona | -- | None Available | |
| Meyer Edward Richard | $19,600 | Servicelink | |
| Us Bank National Association | $1,100 | None Available | |
| Arnold Anthony Lester | -- | None Available |
Source: Public Records
Tax History Compared to Growth
Tax History
| Year | Tax Paid | Tax Assessment Tax Assessment Total Assessment is a certain percentage of the fair market value that is determined by local assessors to be the total taxable value of land and additions on the property. | Land | Improvement |
|---|---|---|---|---|
| 2025 | $2,863 | $64,488 | -- | -- |
| 2024 | $2,863 | $58,625 | -- | -- |
| 2023 | $2,282 | $53,295 | $0 | $0 |
| 2022 | $2,144 | $48,450 | $0 | $0 |
| 2021 | $2,041 | $84,110 | $5,400 | $78,710 |
| 2020 | $1,738 | $74,285 | $4,000 | $70,285 |
| 2019 | $1,576 | $56,519 | $4,000 | $52,519 |
| 2018 | $1,517 | $50,872 | $4,000 | $46,872 |
| 2017 | $1,431 | $43,611 | $4,000 | $39,611 |
| 2016 | $1,278 | $27,531 | $4,000 | $23,531 |
| 2015 | $1,298 | $32,200 | $2,850 | $29,350 |
| 2014 | -- | $22,603 | $2,850 | $19,753 |
| 2013 | -- | $27,501 | $3,300 | $24,201 |
Source: Public Records
Map
Nearby Homes
- 2984 Lincoln Blvd
- 2965 Lincoln Blvd
- 3043 Dunbar Ave
- 2924 Dunbar St
- 2992 Douglas Ave
- 2032-2040 Wright St
- Lots 19 & 20 Thomas St
- Lots 21 & 22 Thomas St
- 2012 Wright St
- 2661 Market St
- 2849 Price Ave
- 1948 Lillie St
- 2810 Dunbar Ave
- 1938 Lillie St
- 2219 Carver Ave
- 2045 Carver Ave
- 1861 Lillie St
- 1958 Knight St
- 3115 Edison Ave
- 1905 Knight St
- 2969 Dunbar Ave Unit A
- 2969 Dunbar Ave Unit 2971
- 2971 Dunbar Ave Unit A
- 2971 Dunbar Ave Unit B
- 2971 Dunbar Ave
- 2963 Dunbar Ave
- 2977 Dunbar Ave
- 2968 Lincoln Blvd
- 2974 Lincoln Blvd
- 2962 Lincoln Blvd
- 2976 Dunbar Ave
- 2972 Dunbar Ave
- 2986 Dunbar Ave
- 2989 Dunbar Ave
- 2955 Dunbar St
- 2923 Dunbar St
- 2997 Dunbar St
- 2977 Dunbar St
- 2991 Dunbar Ave
- 2988 Lincoln Blvd