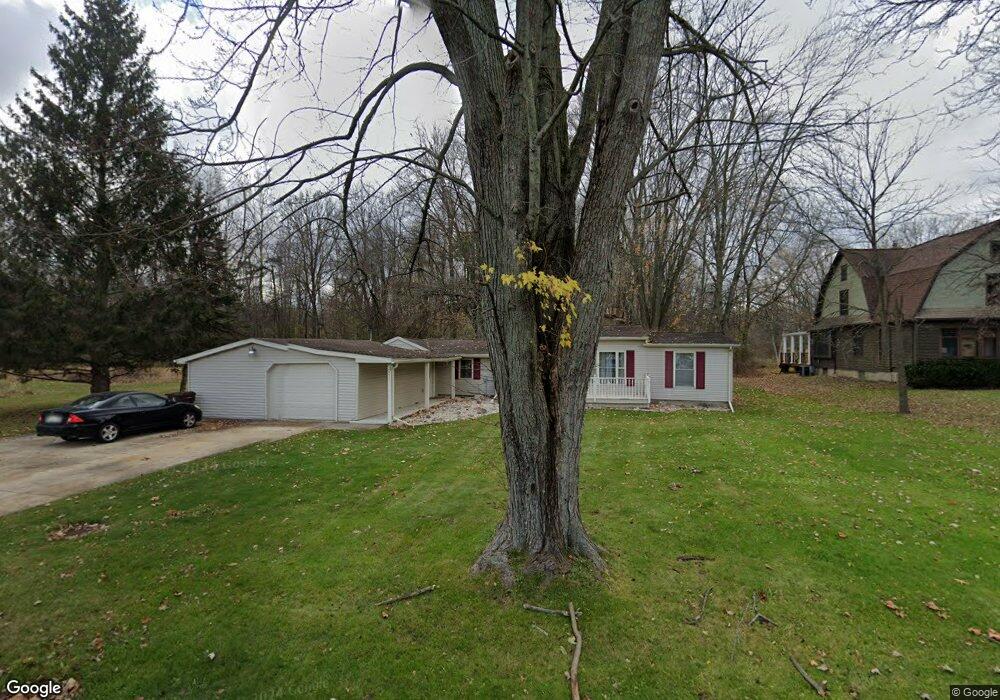
2971 Pinetree Rd Lansing, MI 48911
Estimated Value: $237,577 - $302,000
3
Beds
1
Bath
1,620
Sq Ft
$169/Sq Ft
Est. Value
About This Home
This home is located at 2971 Pinetree Rd, Lansing, MI 48911 and is currently estimated at $273,144, approximately $168 per square foot. 2971 Pinetree Rd is a home located in Ingham County with nearby schools including Elliott Elementary School, Hope Middle School, and Holt Junior High School.
Ownership History
Date
Name
Owned For
Owner Type
Purchase Details
Closed on
Oct 29, 1999
Sold by
Kolonich Paula L and Kolonich Paula
Bought by
Shaver Daniel J
Current Estimated Value
Home Financials for this Owner
Home Financials are based on the most recent Mortgage that was taken out on this home.
Original Mortgage
$51,716
Interest Rate
8.02%
Mortgage Type
Purchase Money Mortgage
Purchase Details
Closed on
Sep 17, 1999
Sold by
Estate Of Lawrence L Lemanski
Bought by
Kolonich Paula L
Home Financials for this Owner
Home Financials are based on the most recent Mortgage that was taken out on this home.
Original Mortgage
$51,716
Interest Rate
8.02%
Mortgage Type
Purchase Money Mortgage
Purchase Details
Closed on
Jul 24, 1998
Sold by
Kolonich Gilbert B and Kolonich Paula L
Bought by
Kolonich Paula L
Create a Home Valuation Report for This Property
The Home Valuation Report is an in-depth analysis detailing your home's value as well as a comparison with similar homes in the area
Home Values in the Area
Average Home Value in this Area
Purchase History
| Date | Buyer | Sale Price | Title Company |
|---|---|---|---|
| Shaver Daniel J | $58,500 | First American Title Ins Co | |
| Kolonich Paula L | $85,000 | First American Title Ins Co | |
| Kolonich Paula L | $100 | -- |
Source: Public Records
Mortgage History
| Date | Status | Borrower | Loan Amount |
|---|---|---|---|
| Previous Owner | Shaver Daniel J | $51,716 | |
| Previous Owner | Kolonich Paula L | $63,750 | |
| Closed | Kolonich Paula L | $17,000 |
Source: Public Records
Tax History Compared to Growth
Tax History
| Year | Tax Paid | Tax Assessment Tax Assessment Total Assessment is a certain percentage of the fair market value that is determined by local assessors to be the total taxable value of land and additions on the property. | Land | Improvement |
|---|---|---|---|---|
| 2025 | $2,977 | $110,300 | $10,900 | $99,400 |
| 2024 | $2,775 | $96,000 | $10,900 | $85,100 |
| 2023 | $2,775 | $80,400 | $10,900 | $69,500 |
| 2022 | $2,643 | $75,200 | $10,900 | $64,300 |
| 2021 | $2,594 | $72,400 | $10,900 | $61,500 |
| 2020 | $2,650 | $68,700 | $10,900 | $57,800 |
| 2019 | $2,518 | $61,500 | $10,900 | $50,600 |
| 2018 | $2,503 | $53,500 | $9,700 | $43,800 |
| 2017 | $2,318 | $53,500 | $9,700 | $43,800 |
| 2016 | $2,297 | $50,400 | $9,700 | $40,700 |
| 2015 | $2,275 | $47,600 | $19,345 | $28,255 |
| 2014 | $2,275 | $46,100 | $23,563 | $22,537 |
Source: Public Records
Map
Nearby Homes
- 3990 Camperdown Dr
- 3980 Applegrove Ln
- 2986 Beech Ridge Dr
- 3836 Sandhill Rd
- 0 Dell Rd Unit 290382
- 2611 Navigator
- 4094 Sebring Dr
- 4106 Sebring Dr
- 2698 Galiot Ct
- 4118 Sebring Dr
- 2712 Galiot Ct
- 3708 David Ln
- 2655 Navigator Ln
- 2683 Dellridge Dr
- 2650 Navigator Ln
- 2711 Galiot Ct
- 2645 Navigator Ln
- 2635 Navigator Ln
- 2617 Navigator Ln
- 2668 Maritime Dr
- 2977 Pinetree Rd
- 2970 Pinetree Rd
- 2960 Pine Tree Rd
- 2980 Pinetree Rd
- 2960 Pinetree Rd
- 2995 Pine Tree Rd
- 2995 Pinetree Rd
- 2950 Pinetree Rd
- 3985 Sandhill Rd
- 3971 Sandhill Rd
- 3001 Pinetree Rd
- 3980 Camperdown Dr
- 2955 Whistlewood Way
- 2945 Whistlewood Way
- 2965 Whistlewood Way
- 2979 Whistlewood Way
- 4033 Watts Ln Unit 15
- 4033 Watts Ln
- 3970 Camperdown Dr
- 4035 Watts Ln Unit 14