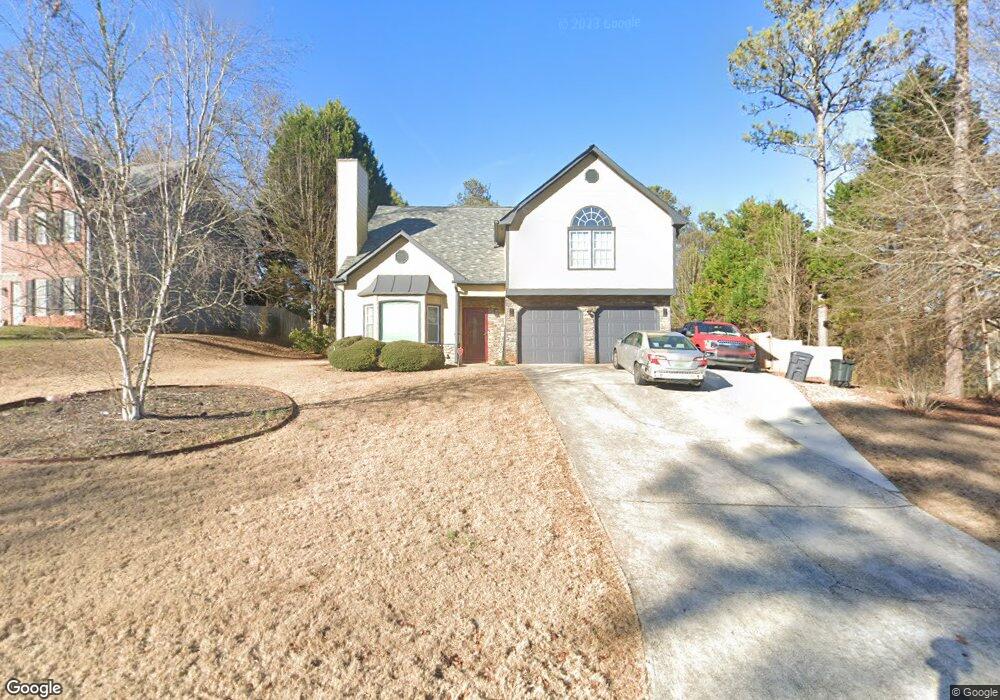
2971 Stone Bridge Trail SW Conyers, GA 30094
Estimated Value: $314,000 - $366,000
4
Beds
3
Baths
2,202
Sq Ft
$155/Sq Ft
Est. Value
About This Home
This home is located at 2971 Stone Bridge Trail SW, Conyers, GA 30094 and is currently estimated at $341,323, approximately $155 per square foot. 2971 Stone Bridge Trail SW is a home located in Rockdale County with nearby schools including Shoal Creek Elementary School, Gen. Ray Davis Middle School, and Heritage High School.
Ownership History
Date
Name
Owned For
Owner Type
Purchase Details
Closed on
Oct 25, 2006
Sold by
Panaseko Oleg and Panaseko Ludmila
Bought by
Barcolleh Desmond and Barcolleh Brenda
Current Estimated Value
Home Financials for this Owner
Home Financials are based on the most recent Mortgage that was taken out on this home.
Original Mortgage
$145,600
Outstanding Balance
$97,147
Interest Rate
8.61%
Mortgage Type
New Conventional
Estimated Equity
$244,176
Purchase Details
Closed on
Sep 16, 2003
Sold by
Panassenko Oleg
Bought by
Panasenko Oleg and Panasenko Ludmila
Home Financials for this Owner
Home Financials are based on the most recent Mortgage that was taken out on this home.
Original Mortgage
$12,500
Interest Rate
6.24%
Mortgage Type
New Conventional
Purchase Details
Closed on
May 17, 2001
Sold by
Gomes Michael A
Bought by
Gomes Hazel I
Create a Home Valuation Report for This Property
The Home Valuation Report is an in-depth analysis detailing your home's value as well as a comparison with similar homes in the area
Home Values in the Area
Average Home Value in this Area
Purchase History
| Date | Buyer | Sale Price | Title Company |
|---|---|---|---|
| Barcolleh Desmond | $182,000 | -- | |
| Panasenko Oleg | -- | -- | |
| Gomes Hazel I | -- | -- |
Source: Public Records
Mortgage History
| Date | Status | Borrower | Loan Amount |
|---|---|---|---|
| Open | Barcolleh Desmond | $145,600 | |
| Previous Owner | Panasenko Oleg | $12,500 |
Source: Public Records
Tax History Compared to Growth
Tax History
| Year | Tax Paid | Tax Assessment Tax Assessment Total Assessment is a certain percentage of the fair market value that is determined by local assessors to be the total taxable value of land and additions on the property. | Land | Improvement |
|---|---|---|---|---|
| 2024 | $2,790 | $115,040 | $19,120 | $95,920 |
| 2023 | $2,333 | $100,760 | $26,360 | $74,400 |
| 2022 | $1,817 | $80,680 | $21,520 | $59,160 |
| 2021 | $1,482 | $64,160 | $15,440 | $48,720 |
| 2020 | $1,075 | $50,240 | $9,640 | $40,600 |
| 2019 | $1,101 | $50,240 | $9,640 | $40,600 |
| 2018 | $1,108 | $50,240 | $9,640 | $40,600 |
| 2017 | $623 | $34,320 | $7,080 | $27,240 |
| 2016 | $577 | $34,320 | $7,080 | $27,240 |
| 2015 | $578 | $34,320 | $7,080 | $27,240 |
| 2014 | $499 | $33,440 | $6,200 | $27,240 |
| 2013 | -- | $49,640 | $12,000 | $37,640 |
Source: Public Records
Map
Nearby Homes
- 1401 Stone Bridge Ln SW
- 3190 Water Brook Dr SW
- 3016 Heights Ave SW
- 3208 Highpoint Way SW
- 3011 Flat Shoals Rd SW
- 2887 Bridle Creek Dr SW
- 1048 Falls Brooke Dr
- 2881 Bridle Creek Dr SW Unit 1
- 2923 Hurst Rd SW
- 1221 Rhodes Walk SW
- 2917 Bridle Creek Dr SW Unit 2
- 981 Havenridge Dr SW
- 3906 Rosebay Way SW
- 1103 W Adrian Cir SW
- 1240 Falls Creek Ct
- 1092 W Adrian Cir SW
- 2856 Flat Shoals Rd SW
- 1087 W Adrian Cir SW
- 2900 Waterford Dr SW
- 1084 W Adrian Cir SW
- 2981 Stone Bridge Trail SW
- 2961 Stone Bridge Trail SW
- 2980 Stone Bridge Trail SW
- 2991 Stone Bridge Trail SW
- 0 Stone Bridge Ln Unit 2683054
- 2970 Stone Bridge Trail SW Unit 1
- 1400 Stone Bridge Ln SW
- 3000 Stone Bridge Trail SW Unit 1
- 3000 Stone Bridge Trail SW
- 3021 Water Brook Dr SW
- 3011 Water Brook Dr SW
- 3157 Klondike Rd SW
- 3031 Water Brook Dr SW
- 3001 Stone Bridge Trail SW Unit 1
- 2960 Stone Bridge Trail SW
- 3147 Klondike Rd SW
- 3041 Water Brook Dr SW
- 3010 Stone Bridge Trail SW
- 2950 Stone Bridge Trail SW
- 3011 Stone Bridge Trail SW