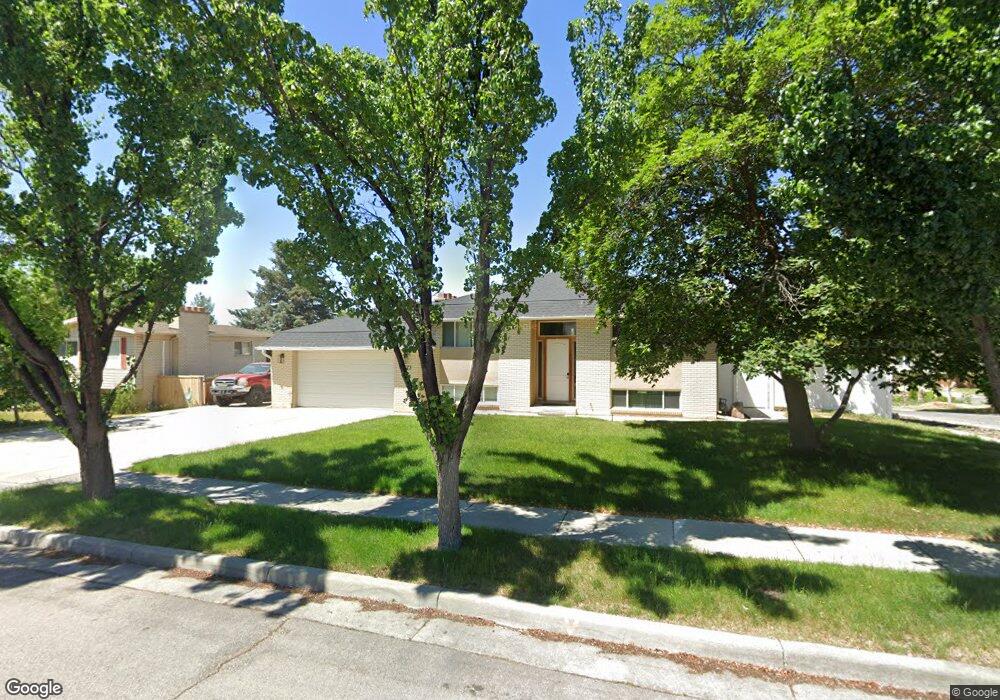
2973 Oakview Cir Salt Lake City, UT 84121
Estimated Value: $630,000 - $748,000
4
Beds
2
Baths
1,062
Sq Ft
$648/Sq Ft
Est. Value
About This Home
This home is located at 2973 Oakview Cir, Salt Lake City, UT 84121 and is currently estimated at $688,593, approximately $648 per square foot. 2973 Oakview Cir is a home located in Salt Lake County with nearby schools including Canyon View School, Butler Middle School, and Brighton High School.
Ownership History
Date
Name
Owned For
Owner Type
Purchase Details
Closed on
May 8, 2018
Sold by
Manikowski Justin
Bought by
Manikowski Justin
Current Estimated Value
Home Financials for this Owner
Home Financials are based on the most recent Mortgage that was taken out on this home.
Original Mortgage
$240,000
Outstanding Balance
$206,838
Interest Rate
4.44%
Mortgage Type
New Conventional
Estimated Equity
$481,755
Purchase Details
Closed on
Feb 7, 2018
Sold by
Manikowski Danielle Joy
Bought by
Manikowski Justin
Purchase Details
Closed on
Dec 10, 2012
Sold by
Manikowski Justin
Bought by
Manikowski Justin and Manikowski Danielle Joy
Purchase Details
Closed on
Jul 6, 2002
Sold by
Lum Raymond P K and Lum Nora T S
Bought by
Manikowski Justin
Home Financials for this Owner
Home Financials are based on the most recent Mortgage that was taken out on this home.
Original Mortgage
$141,550
Interest Rate
6.71%
Create a Home Valuation Report for This Property
The Home Valuation Report is an in-depth analysis detailing your home's value as well as a comparison with similar homes in the area
Home Values in the Area
Average Home Value in this Area
Purchase History
| Date | Buyer | Sale Price | Title Company |
|---|---|---|---|
| Manikowski Justin | -- | North American Title Llc | |
| Manikowski Justin | -- | Accommodation | |
| Manikowski Justin | -- | Eagle Gate Title Ins Agcy | |
| Manikowski Justin | -- | Title West |
Source: Public Records
Mortgage History
| Date | Status | Borrower | Loan Amount |
|---|---|---|---|
| Open | Manikowski Justin | $240,000 | |
| Previous Owner | Manikowski Justin | $141,550 |
Source: Public Records
Tax History Compared to Growth
Tax History
| Year | Tax Paid | Tax Assessment Tax Assessment Total Assessment is a certain percentage of the fair market value that is determined by local assessors to be the total taxable value of land and additions on the property. | Land | Improvement |
|---|---|---|---|---|
| 2025 | $3,260 | $602,900 | $256,400 | $346,500 |
| 2024 | $3,260 | $581,300 | $246,800 | $334,500 |
| 2023 | $3,021 | $523,800 | $237,400 | $286,400 |
| 2022 | $3,094 | $529,400 | $222,200 | $307,200 |
| 2021 | $2,811 | $400,300 | $167,600 | $232,700 |
| 2020 | $2,584 | $345,800 | $167,600 | $178,200 |
| 2019 | $2,498 | $324,600 | $158,100 | $166,500 |
| 2018 | $2,339 | $307,900 | $158,100 | $149,800 |
| 2017 | $2,223 | $291,300 | $158,100 | $133,200 |
| 2016 | $2,106 | $261,600 | $142,400 | $119,200 |
| 2015 | $2,382 | $262,800 | $174,600 | $88,200 |
| 2014 | $2,384 | $251,900 | $169,800 | $82,100 |
Source: Public Records
Map
Nearby Homes
- 2862 E Pamela Dr
- 2935 E Denmark Dr
- 2673 Toni Cir
- 7506 Claret St
- 7491 S 2700 E
- 7622 S Cambria Cir
- 7911 Willowcrest Rd
- 3071 E 7335 S
- 8022 Deer Creek Rd
- 3181 E Deer Creek Cove
- 2944 E 7230 S
- 3404 Enchanted Hills Dr
- 3411 Enchanted View Dr
- 2614 E Tuxedo Cir
- 7872 Newport Way
- 7726 S 3500 E
- 3338 E Creek Rd
- 8211 S 2660 E
- 3364 E Creek Rd
- 7977 S Royal Ln
- 2959 Oakview Cir
- 7690 S Biscayne Dr
- 7690 Biscayne Dr
- 2959 E Oakview Cir
- 2968 Cardiff Rd
- 2968 E Cardiff Rd
- 2972 Oakview Cir
- 7723 S Biscayne Dr
- 7711 Biscayne Dr
- 7723 Biscayne Dr
- 2972 E Oakview Cir
- 2941 Oakview Cir
- 2992 Cardiff Rd
- 2956 Oakview Cir
- 2941 E Oakview Cir
- 2941 E Oakview Cir Unit 14
- 2941 E Oakview Cir
- 7737 Biscayne Dr
- 2954 Cardiff Rd
- 2956 E Oakview Cir