2974 Shady Creek Ct Reno, NV 89523
Northgate NeighborhoodEstimated Value: $574,540 - $636,000
3
Beds
2
Baths
1,613
Sq Ft
$378/Sq Ft
Est. Value
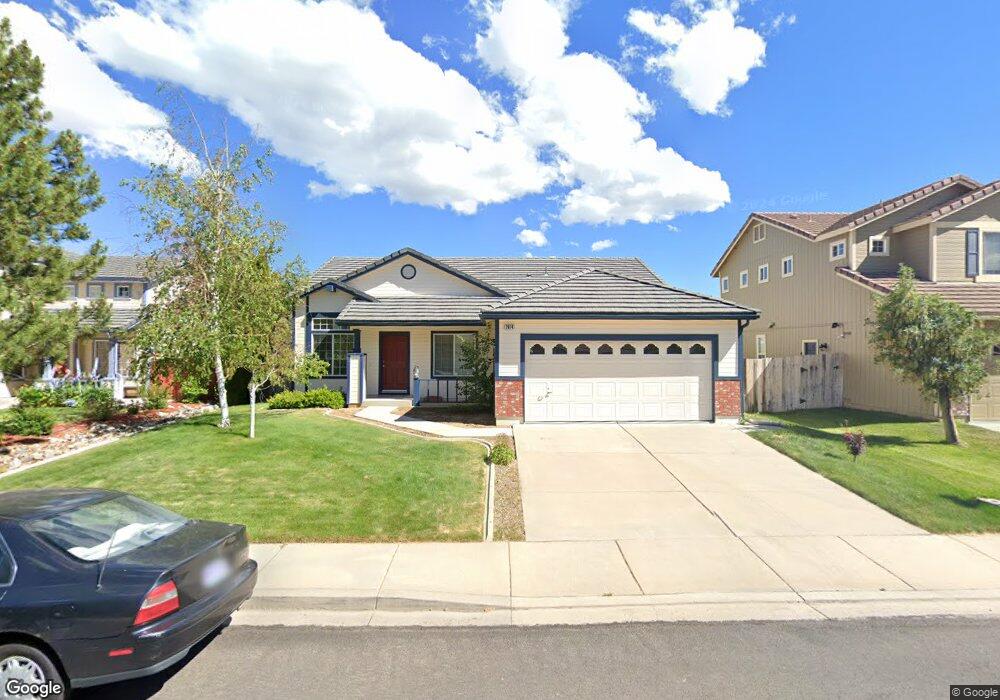
About This Home
This home is located at 2974 Shady Creek Ct, Reno, NV 89523 and is currently estimated at $609,135, approximately $377 per square foot. 2974 Shady Creek Ct is a home located in Washoe County with nearby schools including Rollan D. Melton Elementary School, B D Billinghurst Middle School, and Robert McQueen High School.
Ownership History
Date
Name
Owned For
Owner Type
Purchase Details
Closed on
May 30, 2025
Sold by
Trainor Timothy J
Bought by
Colbert-Trainor Barbara and Trainor Barbara C
Current Estimated Value
Purchase Details
Closed on
Feb 28, 2008
Sold by
Trainor Barbara C
Bought by
Trainor Timothy J and Trainor Barbara C
Home Financials for this Owner
Home Financials are based on the most recent Mortgage that was taken out on this home.
Original Mortgage
$60,000
Interest Rate
5.41%
Mortgage Type
Stand Alone Second
Purchase Details
Closed on
Mar 14, 1996
Sold by
Centex Real Estate Corp
Bought by
Trainor Timothy J and Trainor Barbara C
Home Financials for this Owner
Home Financials are based on the most recent Mortgage that was taken out on this home.
Original Mortgage
$163,372
Interest Rate
7.01%
Mortgage Type
VA
Create a Home Valuation Report for This Property
The Home Valuation Report is an in-depth analysis detailing your home's value as well as a comparison with similar homes in the area
Home Values in the Area
Average Home Value in this Area
Purchase History
| Date | Buyer | Sale Price | Title Company |
|---|---|---|---|
| Colbert-Trainor Barbara | -- | None Listed On Document | |
| Trainor Timothy J | -- | First American Title Reno | |
| Trainor Barbara C | -- | First American Title Reno | |
| Trainor Timothy J | $159,000 | First Centennial Title Co |
Source: Public Records
Mortgage History
| Date | Status | Borrower | Loan Amount |
|---|---|---|---|
| Previous Owner | Trainor Barbara C | $60,000 | |
| Previous Owner | Trainor Timothy J | $163,372 |
Source: Public Records
Tax History Compared to Growth
Tax History
| Year | Tax Paid | Tax Assessment Tax Assessment Total Assessment is a certain percentage of the fair market value that is determined by local assessors to be the total taxable value of land and additions on the property. | Land | Improvement |
|---|---|---|---|---|
| 2025 | $2,537 | $104,774 | $41,396 | $63,378 |
| 2024 | $2,464 | $97,951 | $33,948 | $64,003 |
| 2023 | $2,464 | $98,425 | $37,606 | $60,819 |
| 2022 | $2,395 | $82,811 | $31,887 | $50,924 |
| 2021 | $2,325 | $76,239 | $25,436 | $50,803 |
| 2020 | $2,255 | $76,516 | $25,470 | $51,046 |
| 2019 | $2,190 | $75,015 | $25,470 | $49,545 |
| 2018 | $2,126 | $67,404 | $18,786 | $48,618 |
| 2017 | $2,065 | $66,480 | $17,589 | $48,891 |
| 2016 | $2,012 | $66,069 | $16,725 | $49,344 |
| 2015 | $2,008 | $63,526 | $14,264 | $49,262 |
| 2014 | $1,949 | $59,977 | $12,303 | $47,674 |
| 2013 | -- | $51,546 | $9,210 | $42,336 |
Source: Public Records
Map
Nearby Homes
- 5715 W Brookdale Dr
- 4059 Kings Row
- 5554 Tappan Dr
- 5765 Tappan Dr
- 3981 Regal Dr
- 3967 Kings Row
- 5950 Roxbury Ct
- 3996 Buckingham Square
- 5940 Platinum Ridge Ct
- 2195 Santona Cir
- 5455 Montego Ct
- 2210 Altamira Dr
- 2273 Sapphire Ridge Way
- 5420 Montego Ct
- 2130 Canyon Mesa Ct
- 2101 Soldier Pass Ct
- 5921 Sapphire Ridge Ct
- 2580 Snow Partridge Dr
- 2605 Snow Partridge Dr
- 1915 Celestial Ct
- 2964 Shady Creek Ct
- 2984 Shady Creek Ct
- 2954 Shady Creek Ct
- 2994 Shady Creek Ct
- 5550 E Brookdale Dr
- 2975 Twin Creeks Ct
- 2965 Shady Creek Ct
- 2975 Shady Creek Ct
- 2980 Twin Creeks Ct
- 2955 Shady Creek Ct
- 2944 Shady Creek Ct
- 2985 Shady Creek Ct
- 5540 E Brookdale Dr
- 2945 Shady Creek Ct
- 2995 Shady Creek Ct
- 2934 Shady Creek Ct
- 2935 Shady Creek Ct
- 2965 Twin Creeks Ct
- 5555 E Brookdale Dr