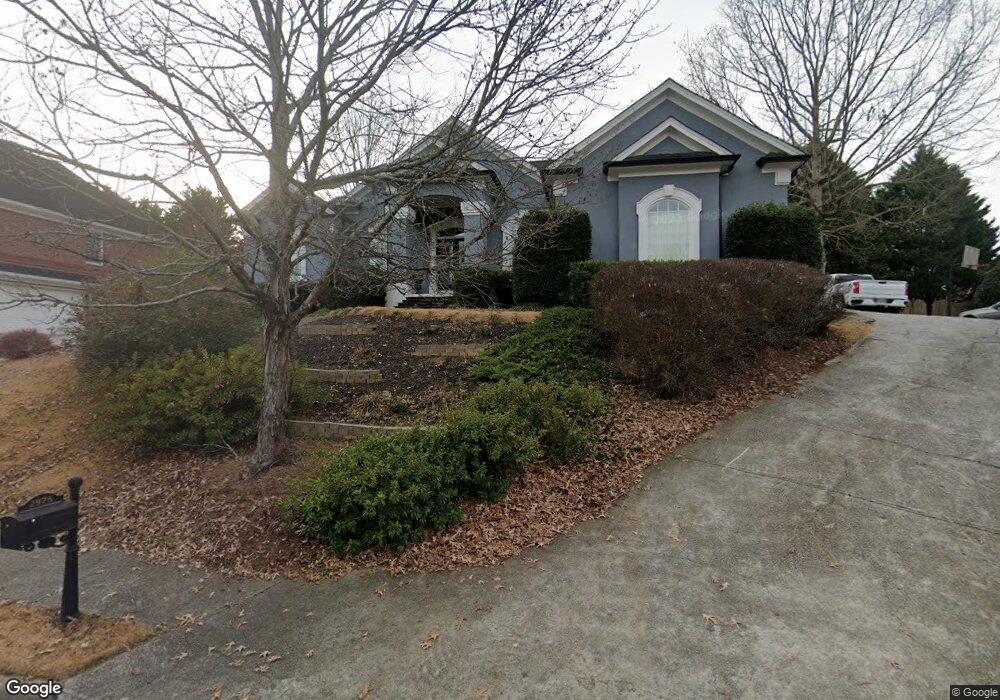
2975 Millwater Crossing NE Dacula, GA 30019
Estimated Value: $511,000 - $535,000
4
Beds
3
Baths
2,560
Sq Ft
$204/Sq Ft
Est. Value
About This Home
This home is located at 2975 Millwater Crossing NE, Dacula, GA 30019 and is currently estimated at $522,091, approximately $203 per square foot. 2975 Millwater Crossing NE is a home located in Gwinnett County with nearby schools including Puckett's Mill Elementary School, Frank N. Osborne Middle School, and Mill Creek High School.
Ownership History
Date
Name
Owned For
Owner Type
Purchase Details
Closed on
Jun 1, 2021
Sold by
Lane Dustin H
Bought by
Nighbert Angela M and Nighbert Chad M
Current Estimated Value
Home Financials for this Owner
Home Financials are based on the most recent Mortgage that was taken out on this home.
Original Mortgage
$351,405
Outstanding Balance
$316,764
Interest Rate
2.9%
Mortgage Type
New Conventional
Estimated Equity
$205,327
Purchase Details
Closed on
Aug 29, 2001
Sold by
Notheis Joseph G
Bought by
Lane Dustin H and Lane Nicole
Home Financials for this Owner
Home Financials are based on the most recent Mortgage that was taken out on this home.
Original Mortgage
$230,850
Interest Rate
6.89%
Mortgage Type
New Conventional
Purchase Details
Closed on
Feb 11, 1999
Sold by
Notheis Joseph G
Bought by
Poulios Charlene
Create a Home Valuation Report for This Property
The Home Valuation Report is an in-depth analysis detailing your home's value as well as a comparison with similar homes in the area
Home Values in the Area
Average Home Value in this Area
Purchase History
| Date | Buyer | Sale Price | Title Company |
|---|---|---|---|
| Nighbert Angela M | $369,900 | -- | |
| Lane Dustin H | $243,000 | -- | |
| Poulios Charlene | -- | -- |
Source: Public Records
Mortgage History
| Date | Status | Borrower | Loan Amount |
|---|---|---|---|
| Open | Nighbert Angela M | $351,405 | |
| Previous Owner | Lane Dustin H | $230,850 |
Source: Public Records
Tax History Compared to Growth
Tax History
| Year | Tax Paid | Tax Assessment Tax Assessment Total Assessment is a certain percentage of the fair market value that is determined by local assessors to be the total taxable value of land and additions on the property. | Land | Improvement |
|---|---|---|---|---|
| 2025 | $7,137 | $213,840 | $59,840 | $154,000 |
| 2024 | $7,194 | $204,160 | $45,600 | $158,560 |
| 2023 | $7,194 | $190,800 | $45,600 | $145,200 |
| 2022 | $5,592 | $147,960 | $40,400 | $107,560 |
| 2021 | $4,867 | $125,440 | $27,200 | $98,240 |
| 2020 | $4,896 | $125,440 | $27,200 | $98,240 |
| 2019 | $4,720 | $125,440 | $27,200 | $98,240 |
| 2018 | $4,327 | $114,040 | $27,200 | $86,840 |
| 2016 | $3,991 | $104,000 | $26,000 | $78,000 |
| 2015 | $4,040 | $104,000 | $26,000 | $78,000 |
| 2014 | -- | $97,080 | $26,000 | $71,080 |
Source: Public Records
Map
Nearby Homes
- 1872 Bakers Mill Rd
- 2585 Millwater Crossing
- 3969 Walkers Ridge Ct
- 3375 Fairway Bend Dr
- 2092 Bakers Mill Rd
- 3349 Collier Point
- 1973 Hamilton Mill Pkwy
- 1727 Bakers Mill Rd
- 3222 Green Farm Trail
- 3420 Millwater Crossing
- 2455 Millwater Crossing
- 2107 Town Manor Ct
- 1770 Ridgemill Terrace
- 2405 Millwater Crossing
- 2128 Town Manor Ct
- 3490 Millwater Crossing
- 2975 Millwater Crossing
- 2985 Millwater Crossing
- 2955 Millwater Crossing
- 3182 Mia Ct
- 3199 Mia Ct
- 2945 Millwater Crossing
- 2995 Millwater Crossing
- 3172 Mia Ct
- 2970 Millwater Crossing
- 2980 Millwater Crossing
- 2960 Millwater Crossing
- 2925 Millwater Crossing
- 2925 Millwater Crossing Unit 2
- 3189 Mia Ct
- 2990 Millwater Crossing
- 2950 Millwater Crossing
- 3005 Millwater Crossing
- 3162 Mia Ct
- 2940 Millwater Crossing
- 2915 Millwater Crossing