Estimated Value: $741,000 - $856,000
3
Beds
2
Baths
2,095
Sq Ft
$385/Sq Ft
Est. Value
About This Home
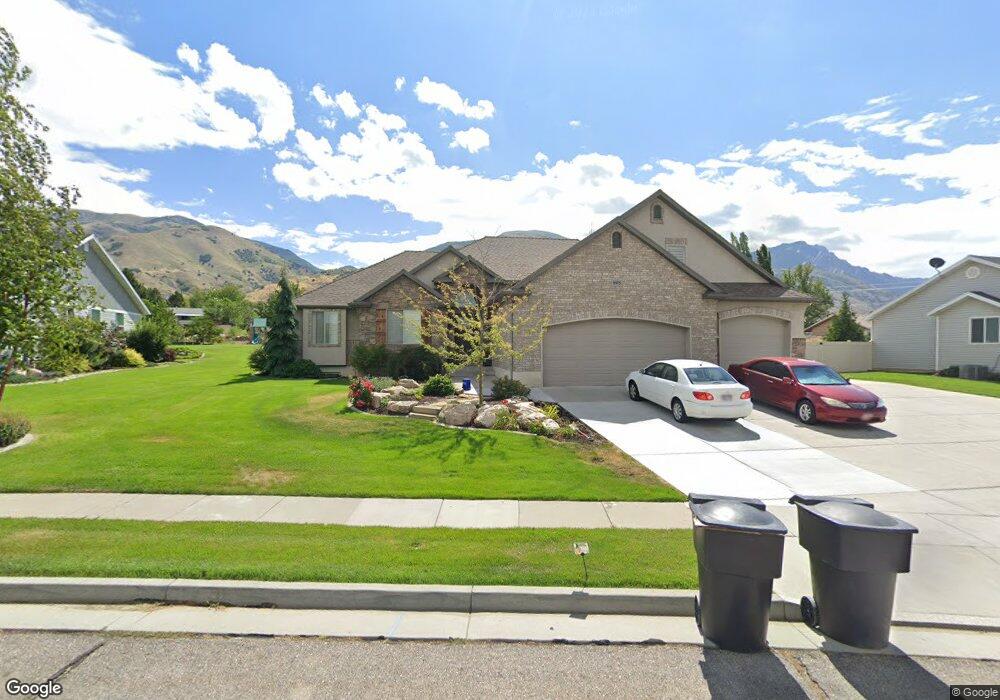
This home is located at 2975 S 1080 W Unit 2, Perry, UT 84302 and is currently estimated at $805,673, approximately $384 per square foot. 2975 S 1080 W Unit 2 is a home located in Box Elder County with nearby schools including Three Mile Creek School, Adele C. Young Intermediate School, and Box Elder Middle School.
Ownership History
Date
Name
Owned For
Owner Type
Purchase Details
Closed on
Dec 16, 2016
Sold by
Sturdevant Bryant and Sturdevant Sarah
Bought by
Roberts David and Roberts Suzanne
Current Estimated Value
Home Financials for this Owner
Home Financials are based on the most recent Mortgage that was taken out on this home.
Original Mortgage
$332,500
Outstanding Balance
$268,653
Interest Rate
3.54%
Mortgage Type
New Conventional
Estimated Equity
$537,020
Purchase Details
Closed on
Apr 27, 2012
Sold by
Barker Joshua T and Barker Britney
Bought by
Sturdevant Bryant and Sturdevant Sarah
Purchase Details
Closed on
Sep 3, 2009
Sold by
Barker Shane
Bought by
Barker Joshua T and Barker Britney
Purchase Details
Closed on
Aug 5, 2009
Sold by
Howard Kent Inc
Bought by
Barker Shane
Create a Home Valuation Report for This Property
The Home Valuation Report is an in-depth analysis detailing your home's value as well as a comparison with similar homes in the area
Home Values in the Area
Average Home Value in this Area
Purchase History
| Date | Buyer | Sale Price | Title Company |
|---|---|---|---|
| Roberts David | -- | Founders Title Company Layto | |
| Sturdevant Bryant | -- | None Available | |
| Barker Joshua T | -- | -- | |
| Barker Shane | -- | -- |
Source: Public Records
Mortgage History
| Date | Status | Borrower | Loan Amount |
|---|---|---|---|
| Open | Roberts David | $332,500 |
Source: Public Records
Tax History Compared to Growth
Tax History
| Year | Tax Paid | Tax Assessment Tax Assessment Total Assessment is a certain percentage of the fair market value that is determined by local assessors to be the total taxable value of land and additions on the property. | Land | Improvement |
|---|---|---|---|---|
| 2025 | $4,168 | $739,004 | $165,000 | $574,004 |
| 2024 | $4,168 | $726,255 | $160,000 | $566,255 |
| 2023 | $4,327 | $769,838 | $160,000 | $609,838 |
| 2022 | $4,148 | $380,573 | $35,750 | $344,823 |
| 2021 | $3,650 | $476,268 | $65,000 | $411,268 |
| 2020 | $3,294 | $476,268 | $65,000 | $411,268 |
| 2019 | $3,245 | $249,315 | $33,000 | $216,315 |
| 2018 | $2,674 | $201,647 | $33,000 | $168,647 |
| 2017 | $2,641 | $268,319 | $0 | $268,319 |
| 2016 | $2,608 | $173,548 | $33,000 | $140,548 |
| 2015 | $2,374 | $160,771 | $33,000 | $127,771 |
| 2014 | $2,374 | $154,686 | $26,884 | $127,802 |
| 2013 | -- | $130,010 | $26,884 | $103,126 |
Source: Public Records
Map
Nearby Homes
- 2975 S 1080 W
- 2925 S Highway 89 Unit 1
- 2925 S Highway 89 Unit 15
- 2925 S Highway 89 Unit 12
- 1273 W 3200 S Unit 6
- 1257 W 3275 S
- 2484 S 900 W
- 2548 S 700 W
- 1480 W 3275 S
- 1424 W 3325 S
- 3295 S 1500 W
- 2460 S 1350 W
- Northfield Plan at West Meadows
- Everley Plan at West Meadows
- Scottsford Plan at West Meadows
- Pembroke Plan at West Meadows
- Hallwood Plan at West Meadows
- Winfield Plan at West Meadows
- Xavier Plan at West Meadows
- Ravenstone Plan at West Meadows
- 2985 S 1080 W
- 2985 S 1080 W Unit 1
- 2965 S 1080 W Unit 3
- 2950 S 1080 W Unit 8
- 2945 S 1080 W Unit 4
- 2945 S 1080 W
- 2970 S 1080 W Unit 9
- 2970 S 1080 W
- 1070 W 3000 S
- 1050 W 3000 S
- 2986 S Highway 89
- 1010 W 3000 S
- 2930 S 1080 W
- 2930 S 1080 W Unit 7
- 2925 S 1080 W
- 2925 S 1080 W Unit 5
- 2988 S 1080 W Unit 10
- 1090 W 3000 S
- 2920 S 1080 W Unit 6
- 2970 S Highway 89