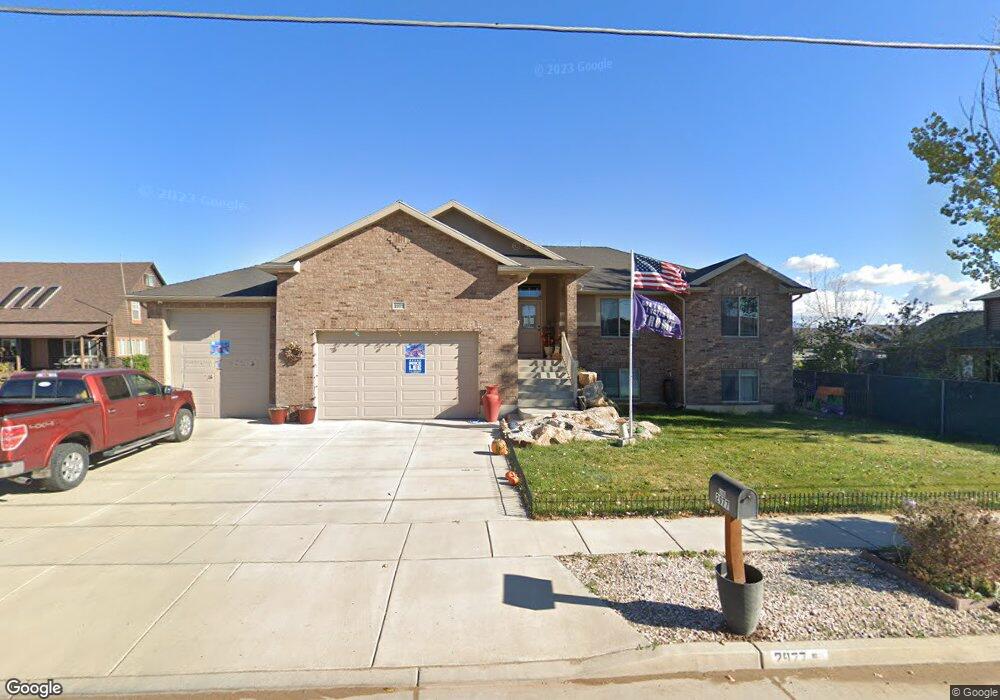
2977 S 2000 W Syracuse, UT 84075
Estimated Value: $635,000 - $651,000
5
Beds
3
Baths
1,612
Sq Ft
$398/Sq Ft
Est. Value
About This Home
This home is located at 2977 S 2000 W, Syracuse, UT 84075 and is currently estimated at $642,322, approximately $398 per square foot. 2977 S 2000 W is a home located in Davis County with nearby schools including Cook School, Legacy Junior High School, and Clearfield High School.
Ownership History
Date
Name
Owned For
Owner Type
Purchase Details
Closed on
Aug 15, 2014
Sold by
Grover Real Estate Inc
Bought by
Koons Kenneth G and Koons Lori B
Current Estimated Value
Home Financials for this Owner
Home Financials are based on the most recent Mortgage that was taken out on this home.
Original Mortgage
$308,750
Outstanding Balance
$234,734
Interest Rate
4.11%
Mortgage Type
New Conventional
Estimated Equity
$407,588
Purchase Details
Closed on
Mar 5, 2014
Sold by
Roberts Jon D and Roberts Leslie
Bought by
Grover Real Estate Inc
Purchase Details
Closed on
Jul 12, 2013
Sold by
Squires Kevin A
Bought by
Roberts Jon D and Roberts Leslie
Home Financials for this Owner
Home Financials are based on the most recent Mortgage that was taken out on this home.
Original Mortgage
$46,400
Interest Rate
3.79%
Mortgage Type
New Conventional
Purchase Details
Closed on
Aug 16, 2006
Sold by
Martinez Arthur and Martinez Lorrie
Bought by
Squires Kevin A
Create a Home Valuation Report for This Property
The Home Valuation Report is an in-depth analysis detailing your home's value as well as a comparison with similar homes in the area
Home Values in the Area
Average Home Value in this Area
Purchase History
| Date | Buyer | Sale Price | Title Company |
|---|---|---|---|
| Koons Kenneth G | -- | Backman Title Service | |
| Grover Real Estate Inc | -- | Backman Title Service | |
| Roberts Jon D | -- | Mountain View Title | |
| Squires Kevin A | -- | Mountain View Title | |
| Squires Kevin A | -- | Executive Title Ins Agency |
Source: Public Records
Mortgage History
| Date | Status | Borrower | Loan Amount |
|---|---|---|---|
| Open | Koons Kenneth G | $308,750 | |
| Previous Owner | Roberts Jon D | $46,400 |
Source: Public Records
Tax History Compared to Growth
Tax History
| Year | Tax Paid | Tax Assessment Tax Assessment Total Assessment is a certain percentage of the fair market value that is determined by local assessors to be the total taxable value of land and additions on the property. | Land | Improvement |
|---|---|---|---|---|
| 2025 | $3,352 | $323,400 | $121,572 | $201,828 |
| 2024 | $3,182 | $309,100 | $107,583 | $201,517 |
| 2023 | $3,181 | $563,000 | $151,295 | $411,705 |
| 2022 | $3,441 | $333,850 | $81,855 | $251,995 |
| 2021 | $3,109 | $467,000 | $118,558 | $348,442 |
| 2020 | $2,778 | $404,000 | $102,667 | $301,333 |
| 2019 | $2,556 | $367,000 | $102,624 | $264,376 |
| 2018 | $2,555 | $364,000 | $97,591 | $266,409 |
| 2016 | $2,122 | $158,565 | $37,719 | $120,846 |
| 2015 | $2,433 | $173,140 | $37,719 | $135,421 |
| 2014 | $756 | $54,864 | $54,864 | $0 |
| 2013 | -- | $60,379 | $60,379 | $0 |
Source: Public Records
Map
Nearby Homes
- 1806 Park Dr
- 2983 S 1765 W
- 2051 W Lydia Ln
- 1694 2975 S Unit D
- 2067 W 3290 S
- 2650 S 2000 W
- 1701 W Ross Rd
- 3074 S Edgewater Ln
- 1695 W 2770 S Unit 203
- 2208 W 2615 S Unit 141
- 2198 W 2615 S Unit 140
- 2158 W 2615 S Unit 137
- 1667 W 2770 S Unit 206
- 2223 S Allison Way
- 1842 W Parkview Dr
- 3253 S Lincoln Ln
- Gambel Oak Plan at Shoreline - Bayview
- Birch Plan at Shoreline - Bayview
- Sycamore Plan at Shoreline - Bayview
- Cedar Plan at Shoreline - Bayview