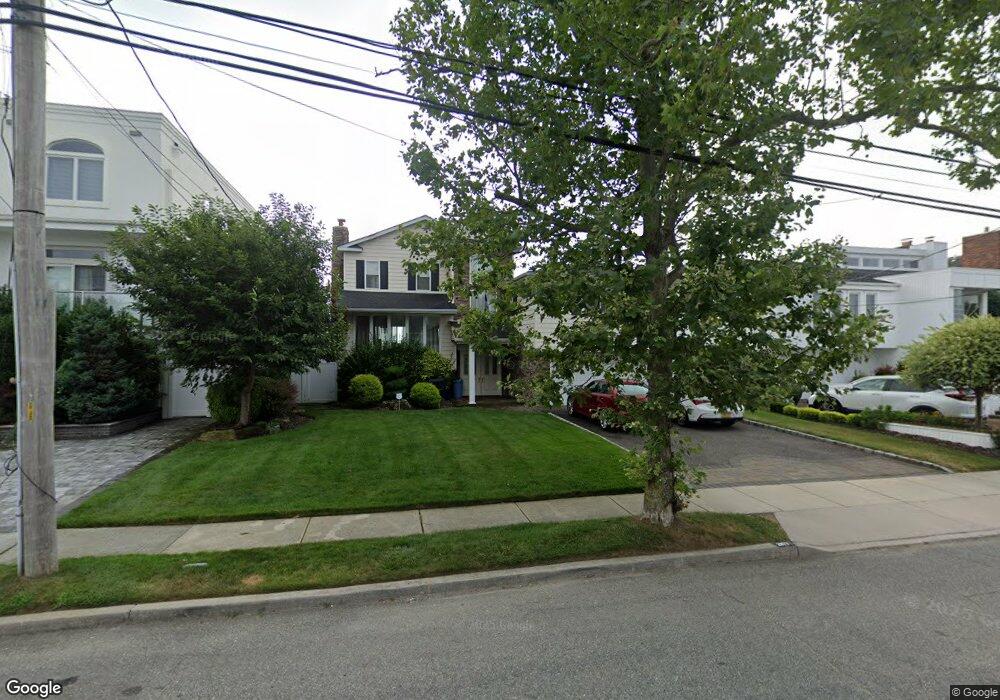
2977 Shore Dr Merrick, NY 11566
Estimated Value: $1,443,000 - $1,519,708
4
Beds
4
Baths
2,314
Sq Ft
$640/Sq Ft
Est. Value
About This Home
This home is located at 2977 Shore Dr, Merrick, NY 11566 and is currently estimated at $1,481,354, approximately $640 per square foot. 2977 Shore Dr is a home located in Nassau County with nearby schools including Burcham Elementary School, Merrick Avenue Middle School, and John F. Kennedy High School.
Ownership History
Date
Name
Owned For
Owner Type
Purchase Details
Closed on
Aug 16, 2021
Sold by
Granite Hill Construction Corp
Bought by
Saweris Nawal and Saweris Wagih
Current Estimated Value
Purchase Details
Closed on
Mar 30, 2012
Sold by
Richmond Sonia
Bought by
Granite Hill Construction Corp
Purchase Details
Closed on
May 22, 2006
Sold by
Glasser Michael
Purchase Details
Closed on
Nov 25, 2002
Sold by
Glasser Michael
Create a Home Valuation Report for This Property
The Home Valuation Report is an in-depth analysis detailing your home's value as well as a comparison with similar homes in the area
Home Values in the Area
Average Home Value in this Area
Purchase History
| Date | Buyer | Sale Price | Title Company |
|---|---|---|---|
| Saweris Nawal | $1,199,000 | Westcor Land Title Ins Co | |
| Granite Hill Construction Corp | $570,000 | -- | |
| -- | $1,250,000 | -- | |
| -- | -- | -- |
Source: Public Records
Tax History Compared to Growth
Tax History
| Year | Tax Paid | Tax Assessment Tax Assessment Total Assessment is a certain percentage of the fair market value that is determined by local assessors to be the total taxable value of land and additions on the property. | Land | Improvement |
|---|---|---|---|---|
| 2025 | $29,505 | $972 | $319 | $653 |
| 2024 | $6,651 | $959 | $315 | $644 |
| 2023 | $34,692 | $1,206 | $396 | $810 |
| 2022 | $34,692 | $1,206 | $396 | $810 |
| 2021 | $48,194 | $1,160 | $381 | $779 |
| 2020 | $59,308 | $1,744 | $1,199 | $545 |
| 2019 | $8,691 | $1,869 | $979 | $890 |
| 2018 | $8,843 | $1,993 | $0 | $0 |
| 2017 | $24,371 | $2,118 | $1,092 | $1,026 |
| 2016 | $33,435 | $2,189 | $1,285 | $904 |
| 2015 | $9,802 | $2,470 | $1,285 | $1,185 |
| 2014 | $9,802 | $2,470 | $1,285 | $1,185 |
| 2013 | $9,662 | $2,573 | $1,285 | $1,288 |
Source: Public Records
Map
Nearby Homes