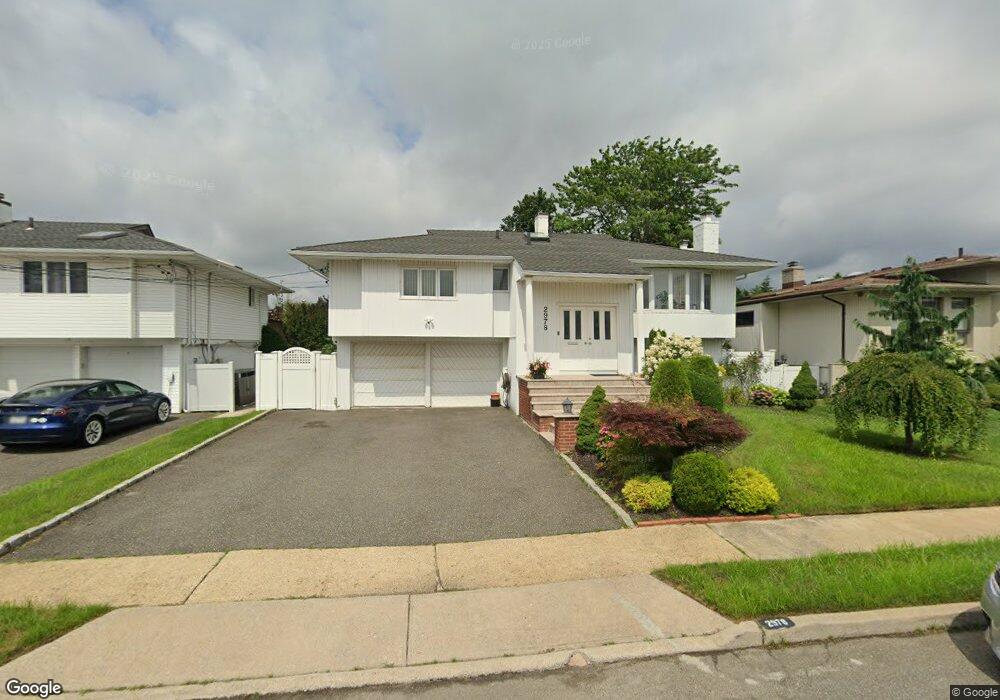
2978 Shore Dr Merrick, NY 11566
Estimated Value: $992,000 - $1,001,186
4
Beds
3
Baths
1,368
Sq Ft
$729/Sq Ft
Est. Value
About This Home
This home is located at 2978 Shore Dr, Merrick, NY 11566 and is currently estimated at $996,593, approximately $728 per square foot. 2978 Shore Dr is a home located in Nassau County with nearby schools including Burcham Elementary School, Merrick Avenue Middle School, and John F. Kennedy High School.
Ownership History
Date
Name
Owned For
Owner Type
Purchase Details
Closed on
Nov 14, 2016
Sold by
Chen Qi Ying and Lin Bi Zhen
Bought by
Jiang Hai Ying
Current Estimated Value
Purchase Details
Closed on
Sep 28, 2012
Sold by
Busch Kenneth I and Busch Nikki
Bought by
Chen Oi Ying and Lin Bi Zhen
Home Financials for this Owner
Home Financials are based on the most recent Mortgage that was taken out on this home.
Original Mortgage
$300,000
Interest Rate
3.59%
Mortgage Type
Purchase Money Mortgage
Create a Home Valuation Report for This Property
The Home Valuation Report is an in-depth analysis detailing your home's value as well as a comparison with similar homes in the area
Home Values in the Area
Average Home Value in this Area
Purchase History
| Date | Buyer | Sale Price | Title Company |
|---|---|---|---|
| Jiang Hai Ying | $580,000 | Fidelity National Title Insu | |
| Chen Oi Ying | $429,500 | -- |
Source: Public Records
Mortgage History
| Date | Status | Borrower | Loan Amount |
|---|---|---|---|
| Previous Owner | Chen Oi Ying | $300,000 |
Source: Public Records
Tax History Compared to Growth
Tax History
| Year | Tax Paid | Tax Assessment Tax Assessment Total Assessment is a certain percentage of the fair market value that is determined by local assessors to be the total taxable value of land and additions on the property. | Land | Improvement |
|---|---|---|---|---|
| 2025 | $18,881 | $622 | $253 | $369 |
| 2024 | $4,357 | $622 | $253 | $369 |
| 2023 | $17,873 | $634 | $258 | $376 |
| 2022 | $17,873 | $622 | $253 | $369 |
| 2021 | $23,812 | $609 | $248 | $361 |
| 2020 | $17,161 | $845 | $760 | $85 |
| 2019 | $16,074 | $860 | $773 | $87 |
| 2018 | $15,364 | $860 | $0 | $0 |
| 2017 | $8,470 | $860 | $773 | $87 |
| 2016 | $12,150 | $860 | $773 | $87 |
| 2015 | $3,413 | $860 | $541 | $319 |
| 2014 | $3,413 | $860 | $541 | $319 |
| 2013 | $3,229 | $860 | $541 | $319 |
Source: Public Records
Map
Nearby Homes