Estimated Value: $390,000 - $432,000
4
Beds
2
Baths
2,040
Sq Ft
$201/Sq Ft
Est. Value
About This Home
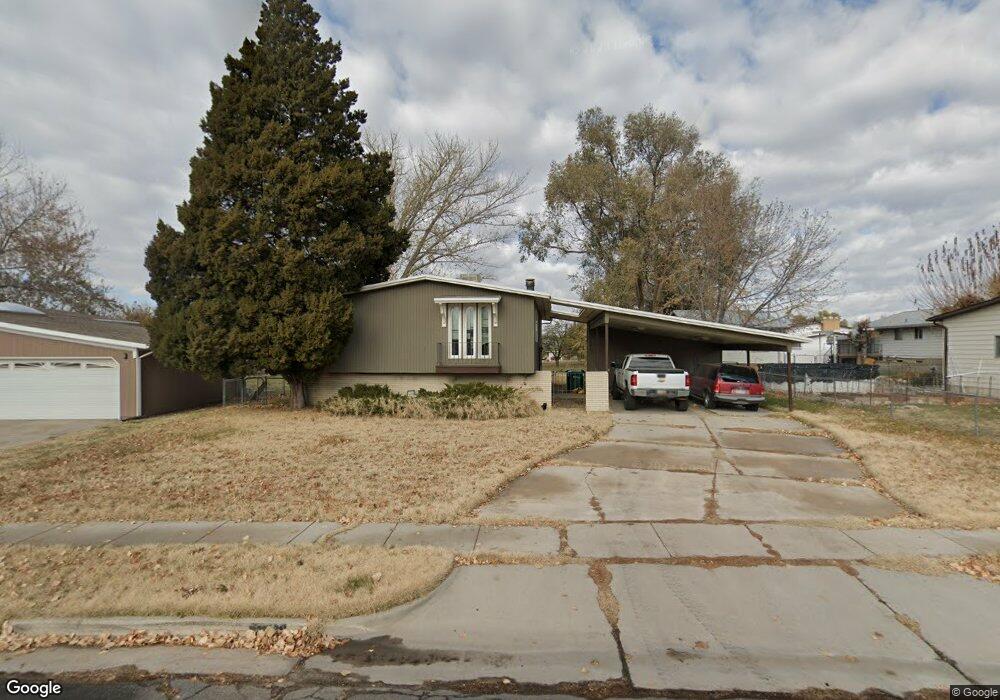
This home is located at 2978 W 6075 S, Roy, UT 84067 and is currently estimated at $409,446, approximately $200 per square foot. 2978 W 6075 S is a home located in Weber County with nearby schools including Roy Elementary School, Roy Junior High School, and Roy High School.
Ownership History
Date
Name
Owned For
Owner Type
Purchase Details
Closed on
Sep 20, 2016
Sold by
Ferguson James M and Ferguson Judy A
Bought by
Kappus Kane C
Current Estimated Value
Home Financials for this Owner
Home Financials are based on the most recent Mortgage that was taken out on this home.
Original Mortgage
$162,000
Outstanding Balance
$129,482
Interest Rate
3.45%
Mortgage Type
New Conventional
Estimated Equity
$279,964
Purchase Details
Closed on
Feb 28, 2011
Sold by
Kappus Sandra C
Bought by
Ferguson James M and Ferguson Judy A
Home Financials for this Owner
Home Financials are based on the most recent Mortgage that was taken out on this home.
Original Mortgage
$75,600
Interest Rate
4.67%
Mortgage Type
New Conventional
Purchase Details
Closed on
Nov 13, 2001
Sold by
Hunter John L
Bought by
Hunter Properties Llc
Create a Home Valuation Report for This Property
The Home Valuation Report is an in-depth analysis detailing your home's value as well as a comparison with similar homes in the area
Home Values in the Area
Average Home Value in this Area
Purchase History
| Date | Buyer | Sale Price | Title Company |
|---|---|---|---|
| Kappus Kane C | -- | Stewart Title Ins Agency | |
| Ferguson James M | -- | Us Title Insurance Agency | |
| Hunter Properties Llc | -- | Bonneville Title |
Source: Public Records
Mortgage History
| Date | Status | Borrower | Loan Amount |
|---|---|---|---|
| Open | Kappus Kane C | $162,000 | |
| Previous Owner | Ferguson James M | $75,600 |
Source: Public Records
Tax History Compared to Growth
Tax History
| Year | Tax Paid | Tax Assessment Tax Assessment Total Assessment is a certain percentage of the fair market value that is determined by local assessors to be the total taxable value of land and additions on the property. | Land | Improvement |
|---|---|---|---|---|
| 2025 | $2,277 | $352,536 | $135,563 | $216,973 |
| 2024 | $2,118 | $180,399 | $74,559 | $105,840 |
| 2023 | $1,865 | $156,750 | $69,635 | $87,115 |
| 2022 | $1,831 | $158,400 | $62,871 | $95,529 |
| 2021 | $1,485 | $209,000 | $81,848 | $127,152 |
| 2020 | $1,425 | $185,000 | $81,848 | $103,152 |
| 2019 | $1,334 | $162,000 | $50,554 | $111,446 |
| 2018 | $1,176 | $132,000 | $45,464 | $86,536 |
| 2017 | $1,164 | $123,000 | $42,406 | $80,594 |
| 2016 | $1,149 | $65,593 | $18,378 | $47,215 |
| 2015 | $1,118 | $65,593 | $18,378 | $47,215 |
| 2014 | $1,126 | $65,593 | $18,378 | $47,215 |
Source: Public Records
Map
Nearby Homes