
Landlord's Agent in 2017
Alice Royster
ACT Properties, LLC
(703) 232-1631
5 Total Sales

Estimated Value: $381,512 - $417,000
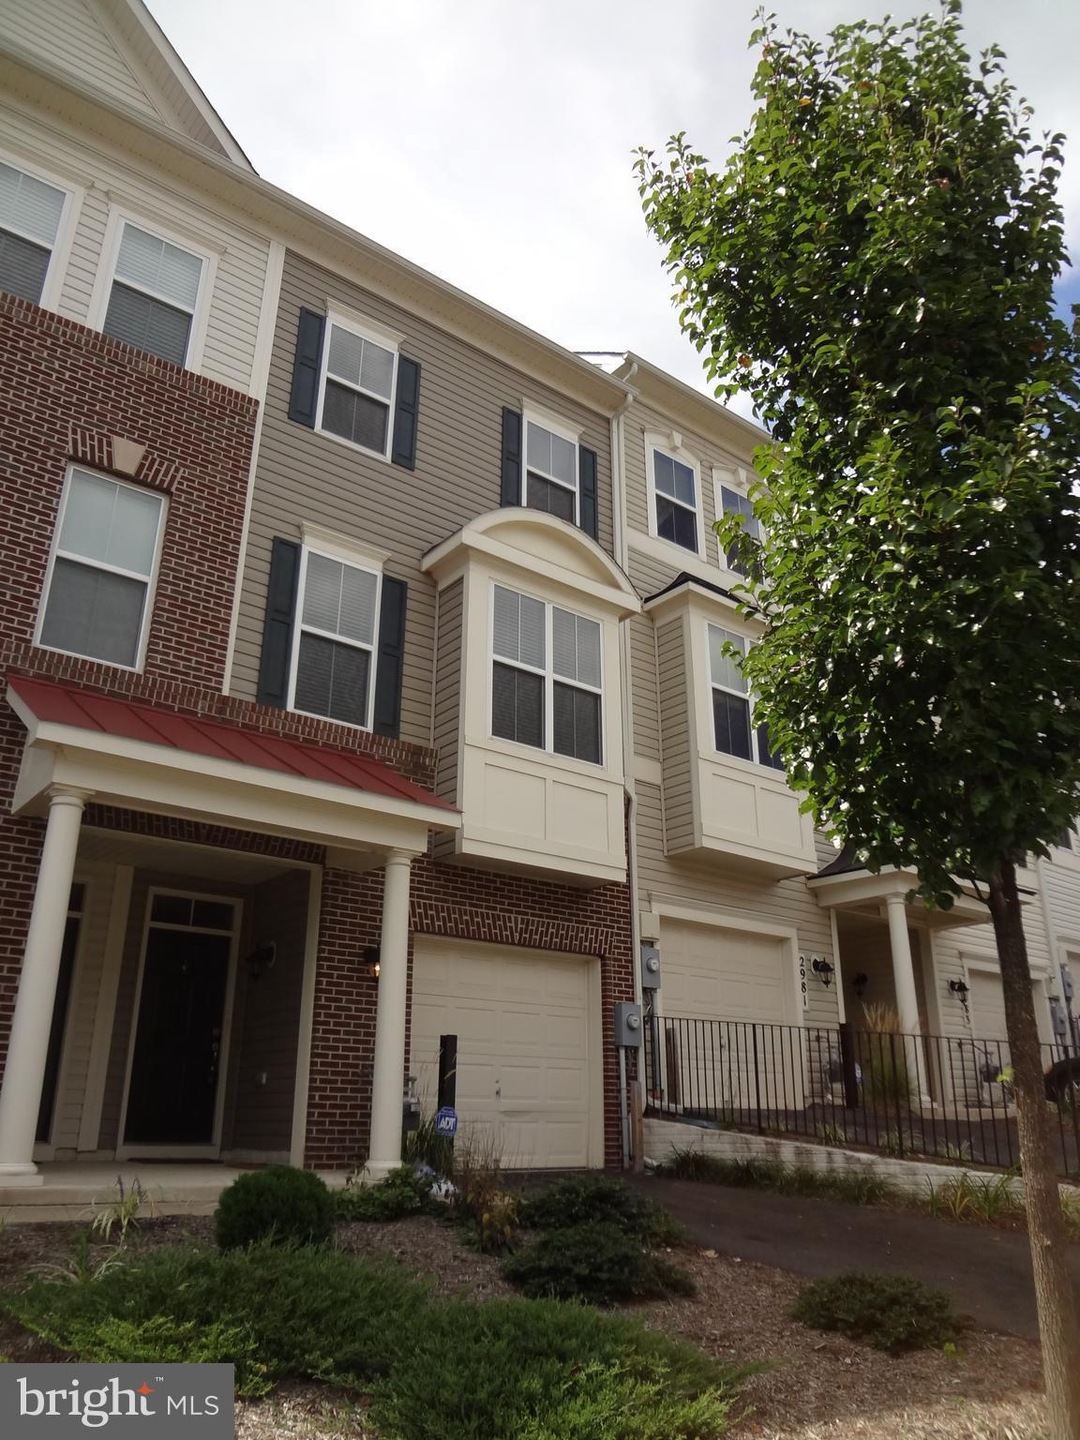
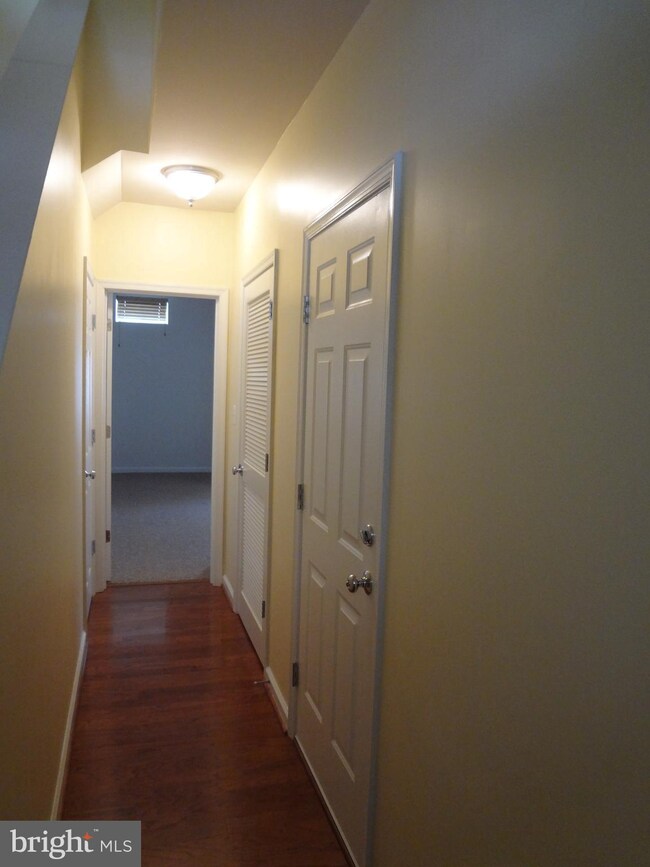
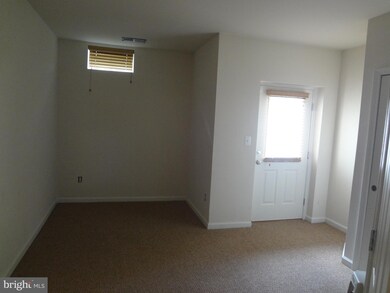
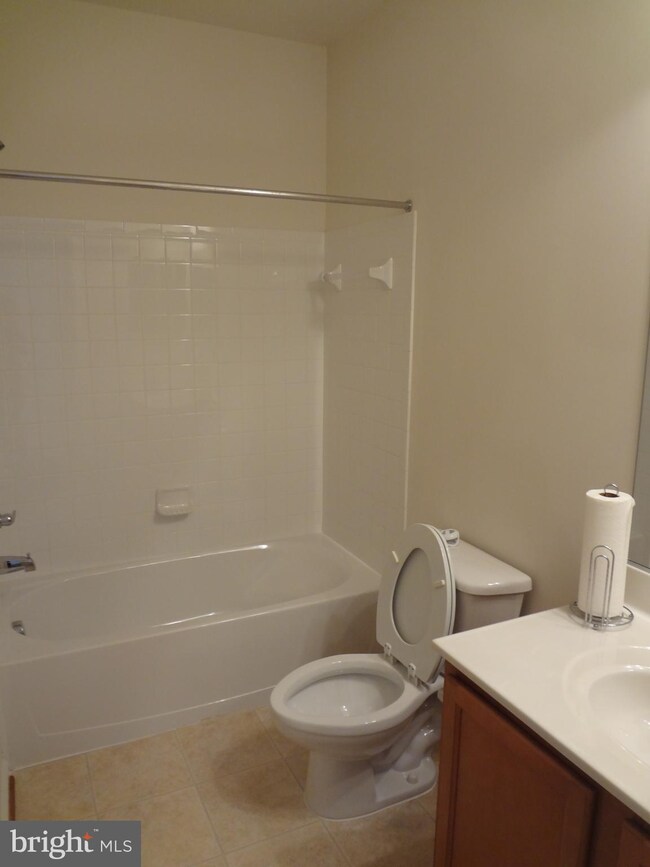
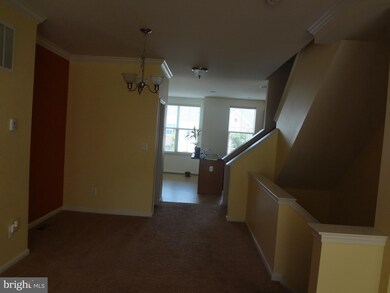
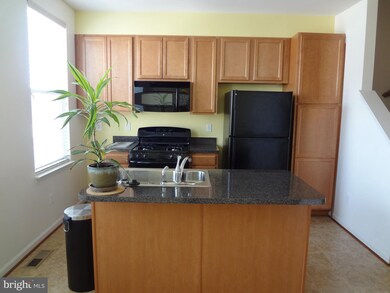
Located between Quantico and Ft Belvoir, this 2 Master Bedroom town home plus 1 bedroom/den at the entrance level offers Suburban living at its best. In the Melody Landing Community, this home is vacant and ready to move-in. Back on the market. Shows Well.
Last Agent to Rent the Property
(703) 232-1631 aroyster@act-propllc.com ACT Properties, LLC License #0225047968 Listed on: 10/08/2017
| Date | Buyer | Sale Price | Title Company |
|---|---|---|---|
| Noland Natalie | $265,045 | Commonwealth Land Title Insu |
| Date | Status | Borrower | Loan Amount |
|---|---|---|---|
| Open | Noland Natalie | $270,743 |
| Date | Event | Price | List to Sale | Price per Sq Ft |
|---|---|---|---|---|
| 11/20/2017 11/20/17 | Rented | $1,850 | 0.0% | -- |
| 10/24/2017 10/24/17 | Under Contract | -- | -- | -- |
| 10/08/2017 10/08/17 | For Rent | $1,850 | 0.0% | -- |
| 09/30/2016 09/30/16 | Rented | $1,850 | 0.0% | -- |
| 09/28/2016 09/28/16 | Under Contract | -- | -- | -- |
| 08/05/2016 08/05/16 | For Rent | $1,850 | +12.1% | -- |
| 12/04/2013 12/04/13 | Rented | $1,650 | -15.4% | -- |
| 12/03/2013 12/03/13 | Under Contract | -- | -- | -- |
| 08/20/2013 08/20/13 | For Rent | $1,950 | -- | -- |
| Year | Tax Paid | Tax Assessment Tax Assessment Total Assessment is a certain percentage of the fair market value that is determined by local assessors to be the total taxable value of land and additions on the property. | Land | Improvement |
|---|---|---|---|---|
| 2025 | -- | $367,600 | $119,100 | $248,500 |
| 2024 | -- | $348,600 | $112,400 | $236,200 |
| 2023 | $3,465 | $333,000 | $107,000 | $226,000 |
| 2022 | $3,473 | $306,400 | $98,200 | $208,200 |
| 2021 | $3,419 | $279,100 | $89,300 | $189,800 |
| 2020 | $4,028 | $259,900 | $83,500 | $176,400 |
| 2019 | $4,056 | $261,700 | $83,500 | $178,200 |
| 2018 | $3,009 | $249,200 | $79,500 | $169,700 |
| 2017 | $3,059 | $247,200 | $78,700 | $168,500 |
| 2016 | $3,009 | $245,400 | $77,900 | $167,500 |
| 2015 | $3,069 | $251,500 | $79,500 | $172,000 |
| 2014 | $3,069 | $245,100 | $77,200 | $167,900 |
Landlord's Agent in 2017
Alice Royster
ACT Properties, LLC
(703) 232-1631
5 Total Sales
Tenant's Agent in 2017
Kwesi Benyan-Eshun
Samson Properties
(571) 830-8070
4 in this area
27 Total Sales
T
Buyer's Agent in 2013
Takara Lewis
Keller Williams Realty/Lee Beaver & Assoc.
(703) 330-2222
Source: Bright MLS
MLS Number: 1001399801
APN: 8289-69-0865.01
Disclaimer: Certain information contained herein is derived from information provided by parties other than Homes.com. All information provided is deemed reliable, but is not guaranteed to be accurate and should be independently verified.
![]() The data relating to real estate for sale on this website appears in part through the BRIGHT Internet Data Exchange program, a voluntary cooperative exchange of property listing data between licensed real estate brokerage firms, and is provided by BRIGHT through a licensing agreement.
The data relating to real estate for sale on this website appears in part through the BRIGHT Internet Data Exchange program, a voluntary cooperative exchange of property listing data between licensed real estate brokerage firms, and is provided by BRIGHT through a licensing agreement.
Listing information is from various brokers who participate in the Bright MLS IDX program and not all listings may be visible on the site.
The property information being provided on or through the website is for the personal, non-commercial use of consumers and such information may not be used for any purpose other than to identify prospective properties consumers may be interested in purchasing.
Some properties which appear for sale on the website may no longer be available because they are for instance, under contract, sold or are no longer being offered for sale.
Property information displayed is deemed reliable but is not guaranteed.
Copyright 2025 Bright MLS, Inc.