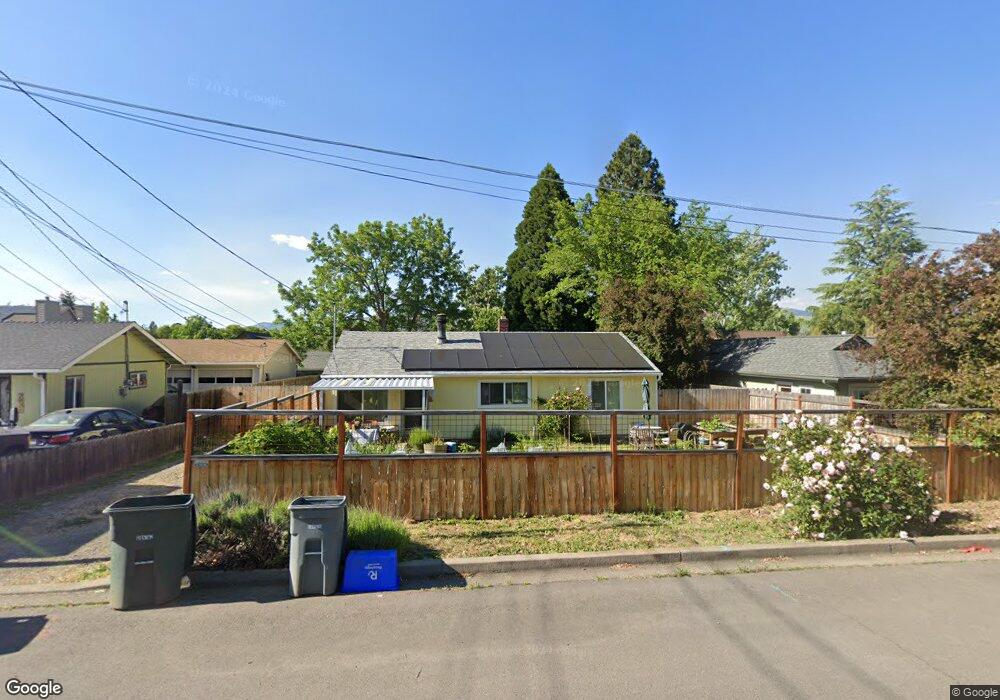
2979 Dianne St Ashland, OR 97520
South Ashland NeighborhoodEstimated Value: $383,000 - $458,000
3
Beds
1
Bath
954
Sq Ft
$434/Sq Ft
Est. Value
About This Home
This home is located at 2979 Dianne St, Ashland, OR 97520 and is currently estimated at $414,112, approximately $434 per square foot. 2979 Dianne St is a home located in Jackson County with nearby schools including Bellview Elementary School, Ashland Middle School, and Ashland High School.
Ownership History
Date
Name
Owned For
Owner Type
Purchase Details
Closed on
Jul 22, 2016
Sold by
Baxter John R and Weisheipl Kelly
Bought by
Fericano Francesca G
Current Estimated Value
Home Financials for this Owner
Home Financials are based on the most recent Mortgage that was taken out on this home.
Original Mortgage
$235,800
Outstanding Balance
$187,201
Interest Rate
3.41%
Mortgage Type
New Conventional
Estimated Equity
$226,911
Purchase Details
Closed on
Aug 15, 2012
Sold by
Weisheipl Kelly and Baxter John R
Bought by
Baxter John R and Weisheipl Kelly
Home Financials for this Owner
Home Financials are based on the most recent Mortgage that was taken out on this home.
Original Mortgage
$136,800
Interest Rate
3.56%
Mortgage Type
New Conventional
Purchase Details
Closed on
Jul 29, 2002
Sold by
Jackson Robert M and Jackson Barbara J
Bought by
Weisheipl Kelly and Baxter John R
Home Financials for this Owner
Home Financials are based on the most recent Mortgage that was taken out on this home.
Original Mortgage
$142,800
Interest Rate
6.6%
Create a Home Valuation Report for This Property
The Home Valuation Report is an in-depth analysis detailing your home's value as well as a comparison with similar homes in the area
Home Values in the Area
Average Home Value in this Area
Purchase History
| Date | Buyer | Sale Price | Title Company |
|---|---|---|---|
| Fericano Francesca G | $262,000 | First American | |
| Baxter John R | -- | Amerititle | |
| Weisheipl Kelly | $168,000 | First American Title Ins Co |
Source: Public Records
Mortgage History
| Date | Status | Borrower | Loan Amount |
|---|---|---|---|
| Open | Fericano Francesca G | $235,800 | |
| Previous Owner | Baxter John R | $136,800 | |
| Previous Owner | Weisheipl Kelly | $142,800 |
Source: Public Records
Tax History Compared to Growth
Tax History
| Year | Tax Paid | Tax Assessment Tax Assessment Total Assessment is a certain percentage of the fair market value that is determined by local assessors to be the total taxable value of land and additions on the property. | Land | Improvement |
|---|---|---|---|---|
| 2025 | $3,424 | $276,310 | $125,230 | $151,080 |
| 2024 | $3,424 | $214,440 | $121,590 | $92,850 |
| 2023 | $2,712 | $170,410 | $111,370 | $59,040 |
| 2022 | $2,625 | $170,410 | $111,370 | $59,040 |
| 2021 | $2,535 | $165,450 | $108,130 | $57,320 |
| 2020 | $2,464 | $160,640 | $104,990 | $55,650 |
| 2019 | $2,425 | $151,430 | $98,970 | $52,460 |
| 2018 | $2,291 | $147,020 | $96,090 | $50,930 |
| 2017 | $2,275 | $147,020 | $96,090 | $50,930 |
| 2016 | $2,215 | $138,590 | $90,580 | $48,010 |
| 2015 | $2,130 | $138,590 | $90,580 | $48,010 |
| 2014 | $2,061 | $130,650 | $85,400 | $45,250 |
Source: Public Records
Map
Nearby Homes
- 775 Tolman Creek Rd
- 2969 Barbara St
- 996 Spring Way
- 2299 Siskiyou Blvd Unit 13
- 2287 Siskiyou Blvd Unit 7
- 874 Blackberry Ln
- 2285 Siskiyou Blvd
- 876 - 878 Clay St
- 2249 Siskiyou Blvd
- 700 Clay St
- 913 Bellview Ave
- 2130 Siskiyou Blvd
- 906 Mary Jane Ave
- 0 Tolman Cr Rd Unit 220204970
- 2663 Takelma Way
- 933 Bellview Ave Unit 2
- 933 Bellview Ave Unit 1
- 799 E Jefferson Ave
- 2023 Siskiyou Blvd
- 766 E Jefferson Ave
- 2979 Diane St
- 2989 Dianne St
- 2971 Dianne St
- 2971 Diane St
- 2989 Diane St
- 798 Capella Cir
- 2959 Diane St
- 00 Tolman Creek Rd
- 815 Tolman Creek Rd
- 2959 Dianne St
- 2978 Dianne St
- 2999 Diane St
- 2978 Diane St
- 2988 Dianne St
- 2970 Diane St
- 2988 Diane St
- 816 Capella Cir
- 2951 Diane St
- 795 Tolman Creek Rd
- 776 Capella Cir