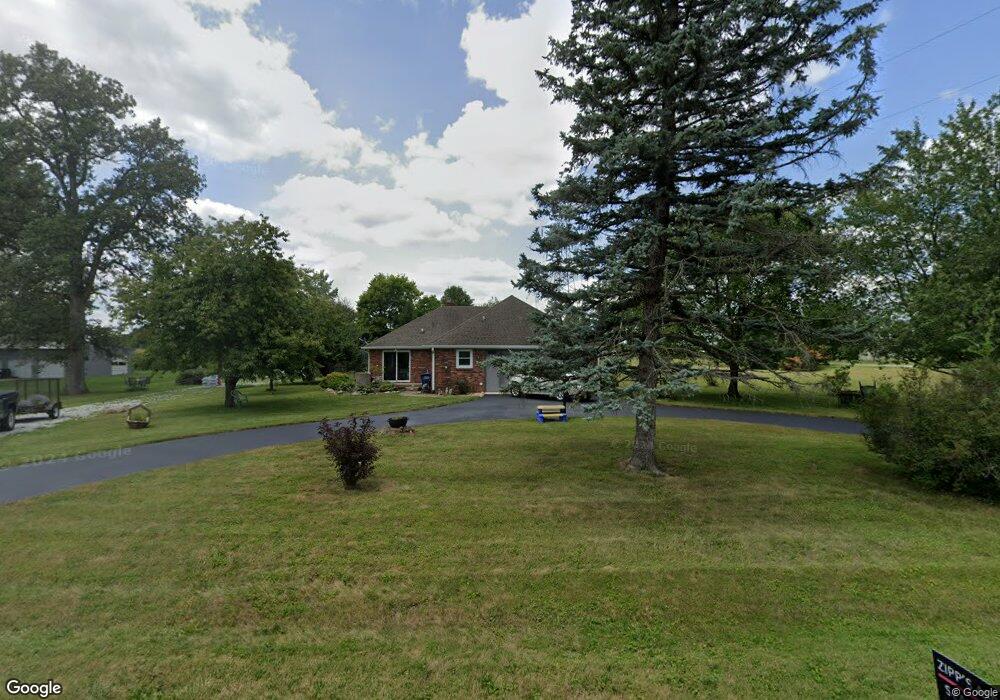
2979 E 300 N Greenfield, IN 46140
Estimated Value: $390,000 - $484,000
3
Beds
2
Baths
2,808
Sq Ft
$154/Sq Ft
Est. Value
About This Home
This home is located at 2979 E 300 N, Greenfield, IN 46140 and is currently estimated at $431,515, approximately $153 per square foot. 2979 E 300 N is a home located in Hancock County with nearby schools including Maxwell Intermediate School, Eden Elementary School, and Greenfield Central Junior High School.
Ownership History
Date
Name
Owned For
Owner Type
Purchase Details
Closed on
Dec 15, 2006
Sold by
Abn Amro Mortgage Group Inc
Bought by
Leroy Daniel C and Leroy Debroah S
Current Estimated Value
Home Financials for this Owner
Home Financials are based on the most recent Mortgage that was taken out on this home.
Original Mortgage
$125,600
Outstanding Balance
$8,027
Interest Rate
6.21%
Mortgage Type
New Conventional
Estimated Equity
$423,488
Purchase Details
Closed on
Oct 10, 2006
Sold by
Mason Harry D
Bought by
Abn Amro Mortgage Group Inc
Create a Home Valuation Report for This Property
The Home Valuation Report is an in-depth analysis detailing your home's value as well as a comparison with similar homes in the area
Home Values in the Area
Average Home Value in this Area
Purchase History
| Date | Buyer | Sale Price | Title Company |
|---|---|---|---|
| Leroy Daniel C | -- | None Available | |
| Abn Amro Mortgage Group Inc | $193,500 | -- |
Source: Public Records
Mortgage History
| Date | Status | Borrower | Loan Amount |
|---|---|---|---|
| Open | Leroy Daniel C | $125,600 |
Source: Public Records
Tax History
| Year | Tax Paid | Tax Assessment Tax Assessment Total Assessment is a certain percentage of the fair market value that is determined by local assessors to be the total taxable value of land and additions on the property. | Land | Improvement |
|---|---|---|---|---|
| 2025 | $2,612 | $335,700 | $61,900 | $273,800 |
| 2024 | $2,612 | $355,300 | $61,900 | $293,400 |
| 2023 | $2,612 | $323,200 | $61,900 | $261,300 |
| 2022 | $1,941 | $263,700 | $35,000 | $228,700 |
| 2021 | $1,675 | $233,800 | $35,000 | $198,800 |
| 2020 | $1,642 | $224,600 | $35,000 | $189,600 |
| 2019 | $1,716 | $230,800 | $35,000 | $195,800 |
| 2018 | $1,742 | $229,300 | $35,000 | $194,300 |
| 2017 | $1,732 | $219,100 | $35,000 | $184,100 |
| 2016 | $1,872 | $215,300 | $34,300 | $181,000 |
| 2014 | $1,855 | $214,200 | $33,700 | $180,500 |
| 2013 | $1,855 | $211,000 | $33,700 | $177,300 |
Source: Public Records
Map
Nearby Homes
- 3513 N 300 E
- 1616 Colorado Spruce Way
- 2420 Fir Dr
- 2415 Fir Dr
- 1631 Colorado Spruce Way
- 2412 Fir Dr
- 1643 Colorado Spruce Way
- 2403 Fir Dr
- 2345 Fir Dr
- 2331 Fir Dr
- 1624 Hemlock Cir
- 1751 Moss Landing Ln
- 2220 Foothill Dr
- 2054 Frost Line Ln
- 2065 Frost Line Ln
- 2053 Frost Line Ln
- 2021 Frost Line Ln
- 2007 Foothill Dr
- 1535 Alpine Ln
- 1615 Clover Crossing Dr
Your Personal Tour Guide
Ask me questions while you tour the home.