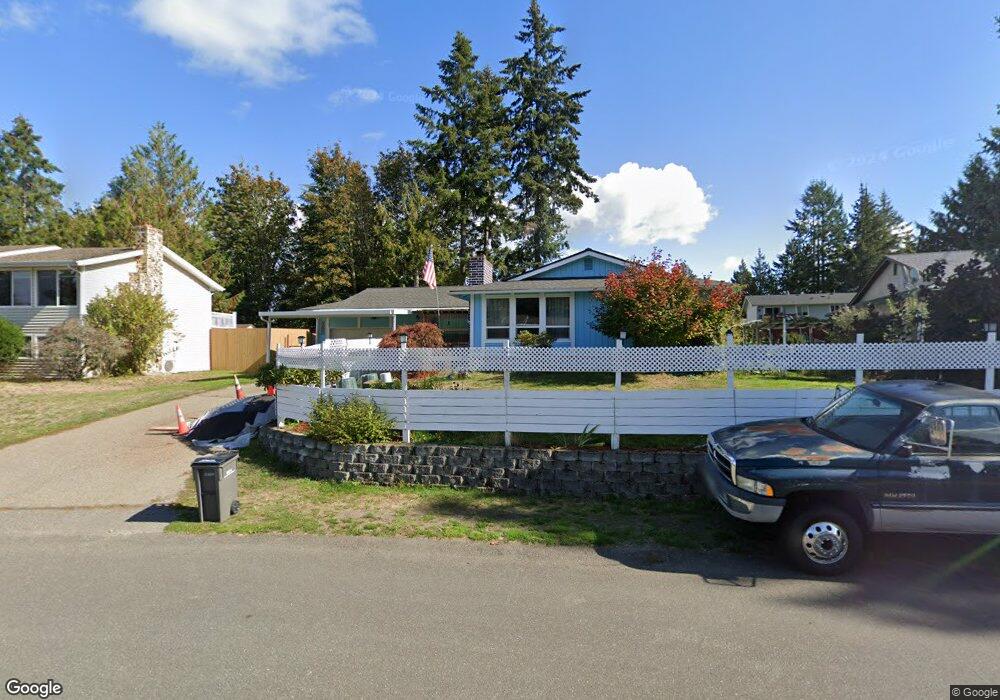
2979 NE Delphi Loop Bremerton, WA 98311
Estimated Value: $440,000 - $480,000
3
Beds
2
Baths
1,499
Sq Ft
$309/Sq Ft
Est. Value
About This Home
This home is located at 2979 NE Delphi Loop, Bremerton, WA 98311 and is currently estimated at $462,619, approximately $308 per square foot. 2979 NE Delphi Loop is a home located in Kitsap County with nearby schools including Esquire Hills Elementary School, Fairview Middle School, and Olympic High School.
Ownership History
Date
Name
Owned For
Owner Type
Purchase Details
Closed on
Jan 30, 2020
Sold by
Randall Dolly L
Bought by
Misinonile Louis Joseph and Ho Thao
Current Estimated Value
Home Financials for this Owner
Home Financials are based on the most recent Mortgage that was taken out on this home.
Original Mortgage
$210,000
Outstanding Balance
$186,293
Interest Rate
3.7%
Mortgage Type
New Conventional
Estimated Equity
$276,326
Purchase Details
Closed on
Nov 24, 2015
Sold by
Randall Dolly L
Bought by
Tomlinson Richard and Randall Dolly L
Home Financials for this Owner
Home Financials are based on the most recent Mortgage that was taken out on this home.
Original Mortgage
$360,000
Interest Rate
3.69%
Mortgage Type
Reverse Mortgage Home Equity Conversion Mortgage
Create a Home Valuation Report for This Property
The Home Valuation Report is an in-depth analysis detailing your home's value as well as a comparison with similar homes in the area
Home Values in the Area
Average Home Value in this Area
Purchase History
| Date | Buyer | Sale Price | Title Company |
|---|---|---|---|
| Misinonile Louis Joseph | $310,000 | Pacific Northwest Ttl Silver | |
| Tomlinson Richard | -- | First American Title Kitsap |
Source: Public Records
Mortgage History
| Date | Status | Borrower | Loan Amount |
|---|---|---|---|
| Open | Misinonile Louis Joseph | $210,000 | |
| Previous Owner | Tomlinson Richard | $360,000 |
Source: Public Records
Tax History Compared to Growth
Tax History
| Year | Tax Paid | Tax Assessment Tax Assessment Total Assessment is a certain percentage of the fair market value that is determined by local assessors to be the total taxable value of land and additions on the property. | Land | Improvement |
|---|---|---|---|---|
| 2026 | $3,807 | $400,770 | $102,280 | $298,490 |
| 2025 | $3,807 | $400,770 | $102,280 | $298,490 |
| 2024 | $3,703 | $400,770 | $102,280 | $298,490 |
| 2023 | $3,716 | $400,770 | $102,280 | $298,490 |
| 2022 | $3,499 | $332,210 | $84,530 | $247,680 |
| 2021 | $3,436 | $310,600 | $62,480 | $248,120 |
| 2020 | $689 | $293,450 | $58,960 | $234,490 |
| 2019 | $1,102 | $264,550 | $53,240 | $211,310 |
| 2018 | $725 | $219,870 | $44,000 | $175,870 |
| 2017 | $758 | $219,870 | $44,000 | $175,870 |
| 2016 | $815 | $197,430 | $39,290 | $158,140 |
| 2015 | $1,232 | $185,380 | $43,520 | $141,860 |
| 2014 | -- | $176,900 | $43,520 | $133,380 |
| 2013 | -- | $176,900 | $43,520 | $133,380 |
Source: Public Records
Map
Nearby Homes
- 2940 Osiris Ct NE
- 3060 NE Mcwilliams Rd Unit 104
- 3060 NE Mcwilliams Rd Unit 124
- 3060 NE Mcwilliams Rd Unit 9
- 7265 Thasos Ave NE
- 3703 NE Trout Brook Ln
- 3744 NE Trout Brook Ln
- 3000 NE Loyola St
- 6305 Rest Place NE
- 3709 NE Liverpool Dr
- 2348 NE Windsor Ct
- 3840 NE Ambleside Ln
- 2112 NE Lexington Dr
- 3 Illahee Rd NE
- 7550 Varsity Ln NE
- 7020 Saint Charles Ln NE
- 7726 Lazy s Ln NE
- 0 University Point Cir NE
- 3532 NE Shore Cliff St
- 6522 State Hwy 303 NE
- 2979 Delphi Loop NE
- 2975 NE Delphi Loop
- 2983 Delphi Ct NE
- 2983 NE Delphi Loop
- 2980 Delphi Loop NE
- 6905 Thebes St NE
- 2980 Delphi Ct NE
- 2980 NE Delphi Loop
- 2971 NE Delphi Loop
- 6925 Thebes St NE
- 6885 Thebes St NE
- 2974 NE Delphi Loop
- 2987 NE Delphi Loop
- 6935 Thebes St NE
- 6855 Thebes St NE
- 2990 Delphi Lp NE
- 2990 NE Delphi Loop
- 2967 NE Delphi Loop
- 2968 NE Delphi Loop
- 2942 Delphi Ct NE