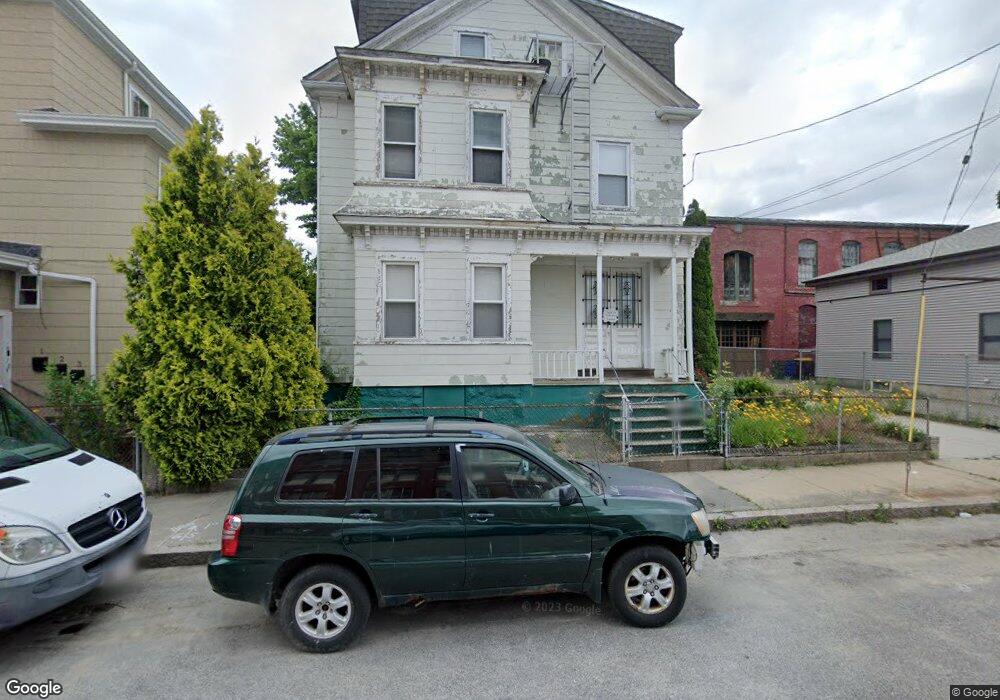
298 3rd St Fall River, MA 02721
Corky Row NeighborhoodEstimated Value: $328,558 - $664,000
6
Beds
3
Baths
4,147
Sq Ft
$126/Sq Ft
Est. Value
About This Home
This home is located at 298 3rd St, Fall River, MA 02721 and is currently estimated at $522,390, approximately $125 per square foot. 298 3rd St is a home located in Bristol County with nearby schools including Henry Lord Community School, B M C Durfee High School, and Antioch School.
Ownership History
Date
Name
Owned For
Owner Type
Purchase Details
Closed on
Jan 20, 2015
Sold by
Cordeiro Maria D
Bought by
Cordeiro John P and Cordeiro Maria O
Current Estimated Value
Purchase Details
Closed on
May 3, 2010
Sold by
Cordeiro Maria D
Bought by
Cordeiro John P and Araujo Maria
Purchase Details
Closed on
Sep 4, 1997
Sold by
Demedeiros Luciana R
Bought by
Cordeiro Joao M and Cordeiro Maria D
Home Financials for this Owner
Home Financials are based on the most recent Mortgage that was taken out on this home.
Original Mortgage
$55,000
Interest Rate
7.36%
Mortgage Type
Purchase Money Mortgage
Create a Home Valuation Report for This Property
The Home Valuation Report is an in-depth analysis detailing your home's value as well as a comparison with similar homes in the area
Home Values in the Area
Average Home Value in this Area
Purchase History
| Date | Buyer | Sale Price | Title Company |
|---|---|---|---|
| Cordeiro John P | -- | -- | |
| Cordeiro John P | -- | -- | |
| Cordeiro Joao M | $75,000 | -- |
Source: Public Records
Mortgage History
| Date | Status | Borrower | Loan Amount |
|---|---|---|---|
| Previous Owner | Cordeiro Joao M | $50,000 | |
| Previous Owner | Cordeiro Joao M | $53,000 | |
| Previous Owner | Cordeiro Joao M | $55,000 |
Source: Public Records
Tax History
| Year | Tax Paid | Tax Assessment Tax Assessment Total Assessment is a certain percentage of the fair market value that is determined by local assessors to be the total taxable value of land and additions on the property. | Land | Improvement |
|---|---|---|---|---|
| 2025 | $5,032 | $439,500 | $108,200 | $331,300 |
| 2024 | $4,815 | $419,100 | $104,200 | $314,900 |
| 2023 | $4,215 | $343,500 | $86,100 | $257,400 |
| 2022 | $3,752 | $297,300 | $82,000 | $215,300 |
| 2021 | $3,556 | $257,100 | $78,000 | $179,100 |
| 2020 | $3,212 | $222,300 | $76,900 | $145,400 |
| 2019 | $2,754 | $188,900 | $74,100 | $114,800 |
| 2018 | $2,820 | $192,900 | $80,200 | $112,700 |
| 2017 | $2,647 | $189,100 | $76,400 | $112,700 |
| 2016 | $2,603 | $191,000 | $81,300 | $109,700 |
| 2015 | $2,498 | $191,000 | $81,300 | $109,700 |
| 2014 | $2,512 | $199,700 | $79,000 | $120,700 |
Source: Public Records
Map
Nearby Homes
Your Personal Tour Guide
Ask me questions while you tour the home.