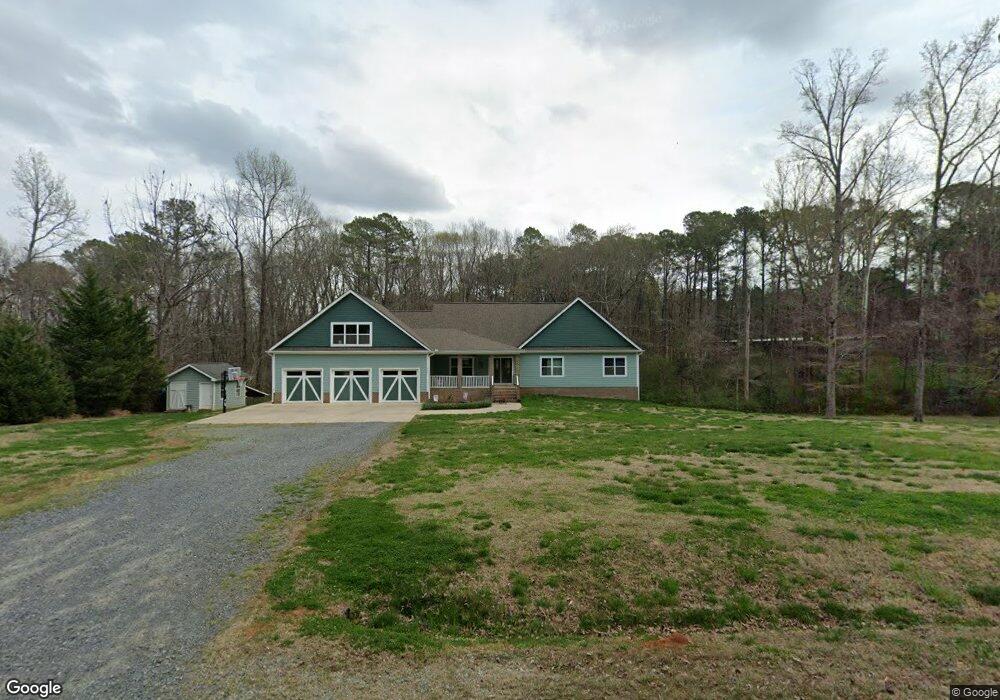
298 Charlie Perkins Rd Pittsboro, NC 27312
Estimated Value: $424,000 - $820,000
3
Beds
3
Baths
2,538
Sq Ft
$265/Sq Ft
Est. Value
About This Home
This home is located at 298 Charlie Perkins Rd, Pittsboro, NC 27312 and is currently estimated at $673,595, approximately $265 per square foot. 298 Charlie Perkins Rd is a home located in Chatham County with nearby schools including Pittsboro Elementary School, George Moses Horton Middle School, and Northwood High.
Ownership History
Date
Name
Owned For
Owner Type
Purchase Details
Closed on
Mar 21, 2019
Sold by
Horton Gene A and Horton Dora L
Bought by
Lindley Jeremy L and Lindley Alicia Leigh
Current Estimated Value
Purchase Details
Closed on
Feb 15, 2013
Sold by
Lindley Jeremy L
Bought by
Lindley Jeremy L and Lindley Alicia Leigh
Create a Home Valuation Report for This Property
The Home Valuation Report is an in-depth analysis detailing your home's value as well as a comparison with similar homes in the area
Home Values in the Area
Average Home Value in this Area
Purchase History
| Date | Buyer | Sale Price | Title Company |
|---|---|---|---|
| Lindley Jeremy L | $2,000 | None Available | |
| Lindley Jeremy L | -- | None Available |
Source: Public Records
Tax History Compared to Growth
Tax History
| Year | Tax Paid | Tax Assessment Tax Assessment Total Assessment is a certain percentage of the fair market value that is determined by local assessors to be the total taxable value of land and additions on the property. | Land | Improvement |
|---|---|---|---|---|
| 2025 | $3,988 | $539,571 | $108,193 | $431,378 |
| 2024 | $3,988 | $445,906 | $104,331 | $341,575 |
| 2023 | $4,005 | $445,904 | $104,331 | $341,573 |
| 2022 | $3,442 | $419,018 | $104,331 | $314,687 |
| 2021 | $3,983 | $406,090 | $104,331 | $301,759 |
| 2020 | $2,854 | $344,351 | $66,390 | $277,961 |
| 2019 | $2,727 | $332,808 | $66,390 | $266,418 |
| 2018 | $2,589 | $328,288 | $61,870 | $266,418 |
| 2017 | $2,522 | $328,288 | $61,870 | $266,418 |
| 2016 | $1,293 | $146,853 | $49,496 | $97,357 |
| 2015 | $1,275 | $146,853 | $49,496 | $97,357 |
| 2014 | $828 | $99,889 | $49,496 | $50,393 |
| 2013 | -- | $74,889 | $49,496 | $25,393 |
Source: Public Records
Map
Nearby Homes
- 120 Elf Way
- 3680 U S 15
- 263 Russell Chapel Church Rd
- 187 Dairymont Dr
- 10 Bynum Beach Rd
- 163 Bynum Church Rd
- 115 Circle City Way
- 588 Rufus C Burnette Dr
- 263 Aspen Ave
- 253 Aspen Ave
- 277 Aspen Ave
- 297 Aspen Ave
- 313 Aspen Ave
- 321 Aspen Ave
- 331 Aspen Ave
- 341 Aspen Ave
- 287 Aspen Ave
- 91 Imagine Way
- 82 Raspberry Run
- 57 Merriville Rd
- 310 Charlie Perkins Rd
- 201 Charlie Perkins Rd Unit B
- 149 Charlie Perkins Rd
- 0 Charlie Perkins Rd Unit TR1866365
- 0 Charlie Perkins Rd Unit TR1866360
- 000 Charlie Perkins Rd
- 117 Elf Way
- 329 W Smith Rd
- 329 W Smith Rd
- 327 W Smith Rd
- 327 W Smith Rd
- 360 Eddie Perry Rd
- 94 Russell Chapel Church Rd
- 81 Charlie Perkins Rd
- 98 Hawk Ridge Rd
- 98 Hawk Ridge Rd Unit 1
- 117 Hawk Ridge
- 75 Elf Way
- 190 Elf Way
- 160 Eddie Perry Rd