

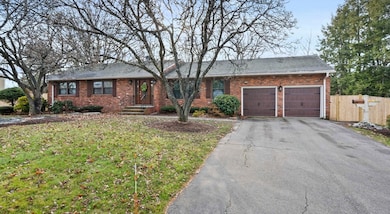


298 Lisle St Braintree, MA 02184
East Braintree NeighborhoodEstimated payment $5,109/month
Highlights
- Golf Course Community
- Property is near public transit
- Wood Flooring
- 0.46 Acre Lot
- Ranch Style House
- Sun or Florida Room
About This Home
Beautiful, Custom built 3-bedroom, 2-bath Brick Ranch conveniently located on a side street in one of Braintree's most sought after neighborhoods, seconds from the Braintree Police Station, Route 3 and the "T".. This well-maintained home features a large tree lined fenced-in yard, a heated 2 car attached garage, and a bright all-glass 4-season sunroom equipped with both AC and heat for year-round comfort. Recent upgrades include a new hot water heater and a new oil tank, providing added peace of mind. Enjoy a spacious, functional layout, durable brick exterior, and excellent curb appeal—perfect for families or anyone seeking convenient single-level living in a sought-after community.

Home Details
Home Type
- Single Family
Est. Annual Taxes
- $7,779
Year Built
- Built in 1967
Lot Details
- 0.46 Acre Lot
- Fenced Yard
Parking
- 2 Car Attached Garage
- Heated Garage
- Driveway
- Open Parking
Home Design
- Ranch Style House
- Brick Exterior Construction
- Frame Construction
- Shingle Roof
- Concrete Perimeter Foundation
Interior Spaces
- 1,732 Sq Ft Home
- Skylights
- Insulated Windows
- Sliding Doors
- Family Room with Fireplace
- Sunken Living Room
- Sun or Florida Room
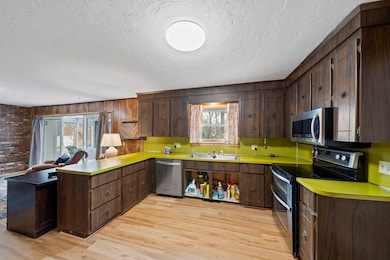
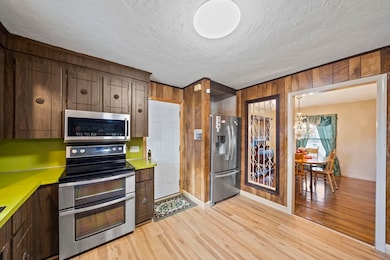
Kitchen
- Range
- Dishwasher
- Stainless Steel Appliances
- Kitchen Island
- Disposal
Flooring
- Wood
- Ceramic Tile
- Vinyl
Bedrooms and Bathrooms
- 3 Bedrooms
- 2 Full Bathrooms
Laundry
- Dryer
- Washer
Unfinished Basement
- Basement Fills Entire Space Under The House
- Block Basement Construction
Outdoor Features
- Bulkhead
Location
- Property is near public transit
- Property is near schools
Utilities
- Cooling System Mounted In Outer Wall Opening
- Heating System Uses Oil
- Baseboard Heating
- 100 Amp Service
- Water Heater
Listing and Financial Details
- Assessor Parcel Number 24371
Community Details
Overview
- No Home Owners Association
- Near Conservation Area
Amenities
- Shops
- Coin Laundry
Recreation
- Golf Course Community
- Park
- Jogging Path
- Bike Trail
Map
Home Values in the Area
Average Home Value in this Area
Tax History
| Year | Tax Paid | Tax Assessment Tax Assessment Total Assessment is a certain percentage of the fair market value that is determined by local assessors to be the total taxable value of land and additions on the property. | Land | Improvement |
|---|---|---|---|---|
| 2025 | $7,779 | $779,500 | $435,800 | $343,700 |
| 2024 | $7,004 | $738,800 | $401,400 | $337,400 |
| 2023 | $6,676 | $684,000 | $367,000 | $317,000 |
| 2022 | $6,349 | $638,100 | $321,100 | $317,000 |
| 2021 | $5,839 | $586,800 | $290,100 | $296,700 |
| 2020 | $5,527 | $560,500 | $263,800 | $296,700 |
| 2019 | $5,407 | $535,900 | $263,800 | $272,100 |
| 2018 | $5,176 | $491,100 | $229,400 | $261,700 |
| 2017 | $5,151 | $479,600 | $217,900 | $261,700 |
| 2016 | $5,068 | $461,600 | $206,400 | $255,200 |
| 2015 | $5,059 | $457,000 | $201,800 | $255,200 |
| 2014 | $4,396 | $384,900 | $175,500 | $209,400 |
Property History
| Date | Event | Price | List to Sale | Price per Sq Ft |
|---|---|---|---|---|
| 12/20/2025 12/20/25 | Price Changed | $849,000 | -5.6% | $490 / Sq Ft |
| 12/10/2025 12/10/25 | For Sale | $899,000 | -- | $519 / Sq Ft |
Purchase History
| Date | Type | Sale Price | Title Company |
|---|---|---|---|
| Deed | -- | -- | |
| Deed | -- | -- | |
| Deed | -- | -- |
Mortgage History
| Date | Status | Loan Amount | Loan Type |
|---|---|---|---|
| Open | $645,000 | Reverse Mortgage Home Equity Conversion Mortgage | |
| Closed | $0 | Purchase Money Mortgage |
Source: MLS Property Information Network (MLS PIN)
MLS Number: 73461279
APN: BRAI-003028C-000000-000035
Disclaimer: Certain information contained herein is derived from information provided by parties other than Homes.com. All information provided is deemed reliable, but is not guaranteed to be accurate and should be independently verified.
![]() The property listing data and information, or the Images, set forth herein were provided to MLS Property Information Network, Inc. from third party sources, including sellers, lessors and public records, and were compiled by MLS Property Information Network, Inc. The property listing data and information, and the Images, are for the personal, non-commercial use of consumers having a good faith interest in purchasing or leasing listed properties of the type displayed to them and may not be used for any purpose other than to identify prospective properties which such consumers may have a good faith interest in purchasing or leasing. MLS Property Information Network, Inc. and its subscribers disclaim any and all representations and warranties as to the accuracy of the property listing data and information, or as to the accuracy of any of the Images, set forth herein.
The property listing data and information, or the Images, set forth herein were provided to MLS Property Information Network, Inc. from third party sources, including sellers, lessors and public records, and were compiled by MLS Property Information Network, Inc. The property listing data and information, and the Images, are for the personal, non-commercial use of consumers having a good faith interest in purchasing or leasing listed properties of the type displayed to them and may not be used for any purpose other than to identify prospective properties which such consumers may have a good faith interest in purchasing or leasing. MLS Property Information Network, Inc. and its subscribers disclaim any and all representations and warranties as to the accuracy of the property listing data and information, or as to the accuracy of any of the Images, set forth herein.
- 124 Louise Rd
- 605 Middle St Unit 38
- 51 Faxon St
- 37 Lantern Ln
- 41 Lantern Ln
- 141 Commercial St Unit 9
- 15 Summer St
- 125 Allen St Unit A
- 74 Magnolia St
- 491 Washington St Unit 1
- 122 Washington St Unit 22
- 141 Hobart St
- 428 John Mahar Hwy Unit 301
- 159 Hobart St
- 11 Richmond St
- 414 John Mahar Hwy Unit 402
- 16 Lindbergh Ave
- 19 Common St
- 23-25 Lindbergh Ave
- 418 John Mahar Hwy Unit 408
- 22 Hamilton St
- 483 Liberty St Unit 2
- 139 Stetson St Unit 2
- 2 Mccusker Dr
- 167 Middle St Unit 2
- 581 Liberty St
- 391 Commercial St
- 141 Commercial St Unit 9
- 32 Sheppard Ave Unit 32
- 30 Sheppard Ave Unit 30
- 79 Shaw
- 78 Summer St
- 52 Wyman Rd Unit 2
- 648 Washington St Unit 2A
- 550 Washington St Unit 210
- 550 Washington St Unit 107
- 550 Washington St Unit 303
- 25 Commercial St
- 11 Sherbrooke Ave Unit 1
- 34 Drinkwater Ave Unit 2