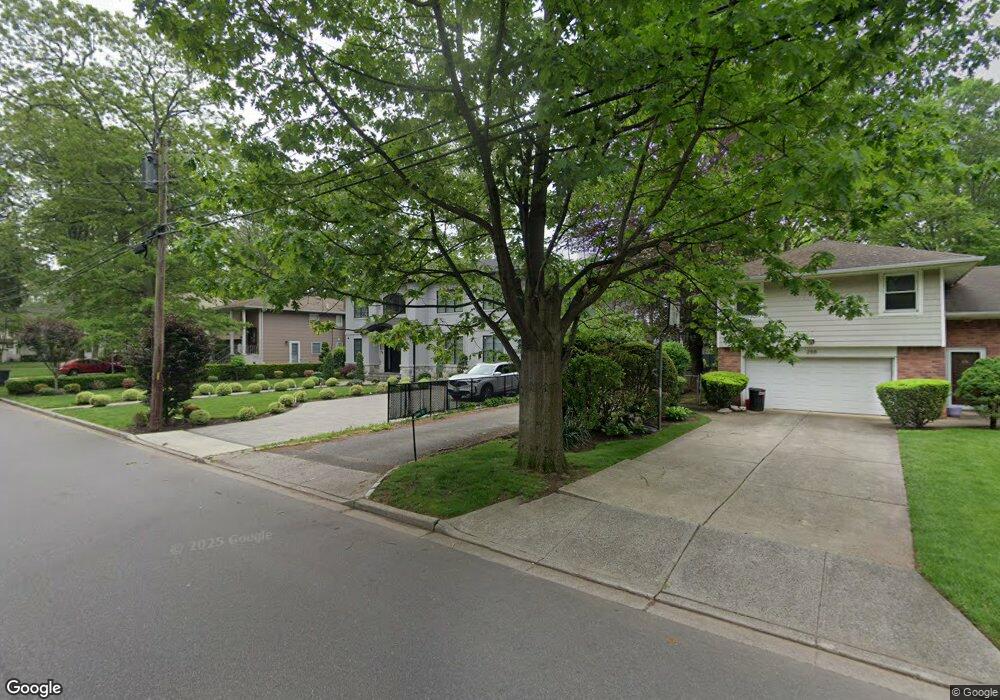
298 Maple St West Hempstead, NY 11552
Estimated Value: $1,580,000 - $2,757,342
4
Beds
2
Baths
6,236
Sq Ft
$348/Sq Ft
Est. Value
About This Home
This home is located at 298 Maple St, West Hempstead, NY 11552 and is currently estimated at $2,168,671, approximately $347 per square foot. 298 Maple St is a home located in Nassau County with nearby schools including Chestnut Street School, West Hempstead Secondary School, and Hebrew Academy of Nassau County (HANC).
Ownership History
Date
Name
Owned For
Owner Type
Purchase Details
Closed on
Sep 17, 2015
Sold by
Bienenfeld Eric S and Bienenfeld Jennifer M
Bought by
Hollander Jeffrey
Current Estimated Value
Home Financials for this Owner
Home Financials are based on the most recent Mortgage that was taken out on this home.
Original Mortgage
$517,500
Outstanding Balance
$405,901
Interest Rate
3.95%
Mortgage Type
New Conventional
Estimated Equity
$1,762,770
Purchase Details
Closed on
Nov 26, 2013
Sold by
Moran Carolyn E and Hofmann Wendy
Bought by
Bienenfeld Eric S and Bienenfield Jennifer M
Home Financials for this Owner
Home Financials are based on the most recent Mortgage that was taken out on this home.
Original Mortgage
$452,000
Interest Rate
4.14%
Mortgage Type
New Conventional
Create a Home Valuation Report for This Property
The Home Valuation Report is an in-depth analysis detailing your home's value as well as a comparison with similar homes in the area
Home Values in the Area
Average Home Value in this Area
Purchase History
| Date | Buyer | Sale Price | Title Company |
|---|---|---|---|
| Hollander Jeffrey | $675,000 | Am Title Agency | |
| Hollander Jeffrey | $675,000 | Am Title Agency | |
| Hollander Jeffrey | $675,000 | Am Title Agency | |
| Bienenfeld Eric S | $565,000 | -- | |
| Bienenfeld Eric S | $565,000 | -- | |
| Bienenfeld Eric S | $565,000 | -- | |
| Bienenfeld Eric S | $565,000 | -- | |
| Bienenfeld Eric S | $565,000 | -- |
Source: Public Records
Mortgage History
| Date | Status | Borrower | Loan Amount |
|---|---|---|---|
| Open | Hollander Jeffrey | $517,500 | |
| Closed | Hollander Jeffrey | $517,500 | |
| Previous Owner | Bienenfeld Eric S | $452,000 |
Source: Public Records
Tax History Compared to Growth
Tax History
| Year | Tax Paid | Tax Assessment Tax Assessment Total Assessment is a certain percentage of the fair market value that is determined by local assessors to be the total taxable value of land and additions on the property. | Land | Improvement |
|---|---|---|---|---|
| 2025 | $24,737 | $1,368 | $276 | $1,092 |
| 2024 | $6,308 | $1,346 | $272 | $1,074 |
| 2023 | $18,635 | $1,407 | $284 | $1,123 |
| 2022 | $18,635 | $1,507 | $341 | $1,166 |
| 2021 | $28,774 | $1,032 | $467 | $565 |
| 2020 | $34,256 | $730 | $730 | $0 |
| 2019 | $13,130 | $730 | $730 | $0 |
| 2018 | $12,375 | $768 | $0 | $0 |
| 2017 | $8,089 | $768 | $667 | $101 |
| 2016 | $11,788 | $841 | $694 | $147 |
| 2015 | $4,191 | $841 | $694 | $147 |
| 2014 | $4,191 | $841 | $694 | $147 |
| 2013 | $3,286 | $884 | $730 | $154 |
Source: Public Records
Map
Nearby Homes
- 686 Tanwood Dr
- 321 Oakford St
- 757 Harrison St
- 635 Hempstead Ave
- 613 Adams Ave
- 590 Langley Ave
- 518 Nassau Blvd
- 513 Washington Ave
- 582 Gaynor Place
- 853 Arthur St
- 467 Susan Ct
- 537 Madison Ave
- 899 Cleveland St
- 596 Lincoln Ave
- 647 Jennings Ave
- 350 Paul Place
- 303 Nassau Blvd
- 19 Richard St
- 815 Sunshine Ave
- 218 Colony St